


Bridgman directional solidification of investment castings is a key technology for the production of reliable and highly efficient gas turbine blades. In this paper, a mathematical model for three-dimensional (3D) simulation of solidification process of single crystal investment castings was developed based on basic heat transfer equations. Complex heat radiation among the multiple blade castings and the furnace wall was considered in the model. Temperature distribution and temperature gradient in superalloy investment castings of single blade and multiple ones were investigated, respectively. The calculated cooling curves were compared with the experimental results and agreed well with the latter. It is indicated that the unsymmetrical temperature distribution and curved liquid-solid interface caused by the circle distribution of multiple turbine blades are probably main reasons why the stray grain and other casting defects occur in the turbine blade.
Key words : Directional solidification; Single crystal; Investment casting; Numerical simulation
Single crystal (SX) Ni-based superalloy turbine blade castings have been widely used in advanced gas turbines for aeronautics and energy industries as well. It is necessary to control the processing conditions during directional solidification to avoid the formation of deleterious casting defects such as stray crystal, freckle, sliver and microporosity. Although the casting technology of advanced gas turbine blades was developed by trail and error in the past, numerical simulation is an effective and powerful tool to help us understand the fundamental of microstructure evolution during directional solidification process and the formation of deleterious casting defects.
Great efforts have been put into studying directional solidification process by numerical simulation in the last two decades. Original researches focused on one-dimensional (1D) model [1-4] . Yu et al . [5,6] studied the directional solidification process through commercial finite element method (FEM) software and developed the defects map which represented the correlation between the thermal gradient and casting defects. A two-dimensional (2D) model was developed by Saitou and Hirata [7] to analyze the shape of liquid-solid interface in Bridgman directional solidification. Galantucci and Tricarico [8] investigated the directional solidification process of turbine blades through 2D FEM with comparison of experimental results. In consideration of heat conduction and radiation, Wang and Overfelt [9] presented a new 2D model which considered the variational radiation view factor with the withdrawal process. Zhu et al. [10] focused on the boundary of heat radiation in directional solidification and developed the software package using regular and irregular mixed grids. Li et al. [11,12] investigated the solidification process of single crystal investment castings by ProCast, a commercial software. Liang et al. [13] simulated the directional solidification process of single turbine blade based on 3D finite difference method (FDM) model.
However, compared with the situation in single turbine blade casting, more complex heat transfer will occur between blades and furnace in the directional solidification of multiple turbine blades (that is the main technology for gas turbines to increase the productivity), and few of research work considered the multiple turbine blades interaction.
In this paper,3D modeling on the basis of FDM method was performed to simulate the solidification of single crystal Ni-based superalloy investment castings. The simulation results of solidification process of single blade and multiple ones were compared with the experimental results, respectively. According to the simulation results, some suggestions were given to improve the directional process.
The schematics of the directional solidification process for single crystal turbine blade is shown in Fig. 1.
The directional solidification process of superalloy investment castings can be described as follows:(1) The mold shell and the water-cooled copper chill plate are preheated to a given temperature. (2) Superalloy melt is poured from the top of the mold and then held for a certain time to keep the uniform temperature distribution. (3) Copper chill plate, mold shell and the high temperature superalloy melt are withdrawn from the heating zone to the cooling zone. During the withdrawal process, the heat transfers from the mold shell to the furnace wall by radiation and from melt to the shell and the chill plate by complex heat transfer. At the same time, the heat is conducted from the chill plate to the cycle-cooled water. (4) When all the parts enter into the cooling zone, the heat transfer continues and the blade completes the solidification process. (5) Due to the chill effect of the copper plate, the nucleation occurs in the melt near the plate and the grains grow continuously with the drop of the local temperature. When the grains grow into the grain selector, there is only one grain allowed to grow out of it. With the advancing of the withdrawal process, the final single crystal blade will be obtained.
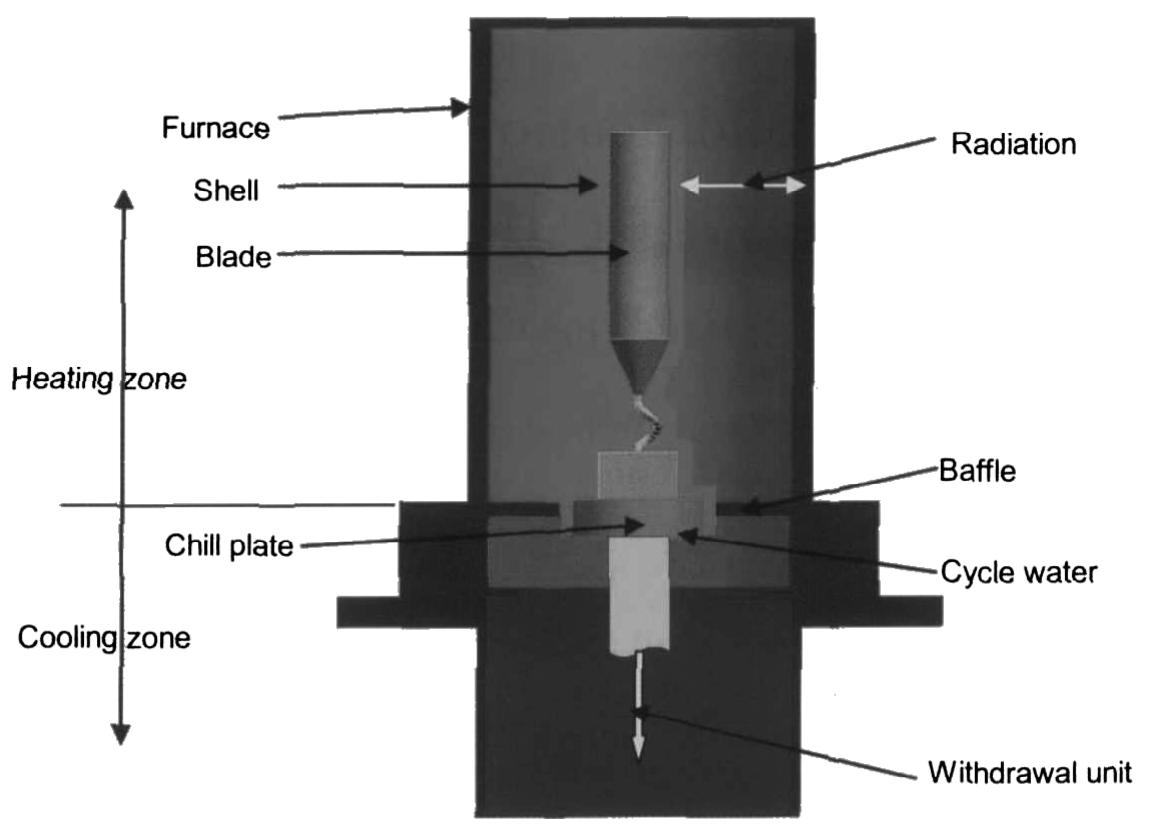
Fig. 1 Schematics of directional solidification process of superalloy turbine blade
In general, the heat transfer during the directional solidification process is determined by the heat conduction in the casting, mold shell and copper chill plate, heat convection between the casting and the mold shell and copper plate, heat radiation between the outside surface of the mold shell and furnace wall, etc .
The transient nonlinear heat conduction equation is as follows:

where T represents temperature, t is time, c is specific heat, L is latent heat, ρ is density, λ is heat conductivity, x , y and z are the coordinates, f s is mass fraction of solid phase and Q net is net energy exchange by radiation between body and external environment. Q net is 0 for the interior of the body.
Since only radiative heat transfer occurs between shell mold and furnace, it is important to deal with the heat radiation boundary condition. According to the law of gray body radiation, the net heat radiation exchange between two gray bodies, Q net ,can be expressed by the following equation based on Stefan-Boltzman law [14] :

where ε 1 and ε 2 are emissivities of the gray bodies 1 and 2, respectively, φ 1, 2 is view factor between two gray bodies, T 1 is the temperature of gray body 1, T 2 is temperature of gray body 2, A 1 and A 2 are areas of two visible surfaces of gray bodies, respectively, and σ is Stefan-Boltzman constant. φ 1, 2 can be calculated as

where θ 1 and θ 2 are the angle between the normal line of the surface of gray bodies and the line connecting the two bodies, respectively, R is distance between the two visible surface and C V is visibility. C V is 0 for non-visibility and 1 for visibility.
Although the analytical model of heat radiation is clear, it is hard to deal with the view factor of a real casting by numerical method. It needs large memory to store the view factors between every two surfaces of different cells and long CPU time to deal with various view factor every time step.
In this paper, a numerical method derived from Monte Carlo method [15] was adopted to deal with the heat radiation between every two discrete surfaces. For the discrete surface i , such as a surface of a finite difference element, the net heat exchange, Q net, i , can be calculated as

where, q out, i is outgoing radiation energy flux of surface i , q in, i is radiation energy being received, A i represents the surface area.
The incoming radiation energy is a combination of the outgoing radiant energy from all the surfaces being visible to surface i . The view factor φ i-j is the ratio of radiant energy leaving from surface j to surface i to all the radiant energy leaving surface j . Thus:

Then the net, heat release of surface i can be expressed as

In Eq.(6),the second part is still hard to deal with numerically because of the large amount of visible surfaces j .The surfaces j may be scattered all around the surface i .So we divide the space enclosing the surface i regularly into limited domains where all surfaces j can locate. The number of domains is set with consideration of computation speed and efficiency. The surfaces located in the same domain could be considered as a single surface with average temperature T domain .The net heat radiation exchange between surface i and a domain, Q net, i -domain ,can be derived from Eq.(2). The area of domain is larger than the discrete surface i .The view factors between the surface i and each domain are equal because we consider that outgoing energy from surface i to each domain is uniform. Based on Eq.(2), Q net, i -domain can be expressed as

Then the Q net, i can be regarded as sum of net heat radiation exchange between surface i and each domain, seen in Eq.(8).

where n domains are labeled by n rays from center of surface i to outer space. Figure 2 is a 2D schematics for the calculation of heat radiation between a cell and its visible cells or furnace wall. The rays are distributed uniformly in a semicircle (half sphere for 3D) space. The reaching end of each ray will be recorded, which may be the shell surface cell in the same or different blade, or the furnace wall. Then the temperature of the nearest end of ray will be memorized and regarded as the temperature of the domain.
A 3D FDM was adopted to solve the basic heat transfer equation. For a 3D finite difference cell I on the surface of shell, there may be 1 to 5 surface (s) involved into heat radiation, each of which can transfer heat by radiation with other visual surface cells. So the cell heat exchange by radiation can be expressed as:

The simulation program was built with Visual C++6.0 by the author.
Two experimental groups were carried out with Ni-based superalloy. One was for single turbine blade and the other for multiple blades. Figure 3(a) and (b) show the 2D models of single blade and multiple ones, respectively. For the multiple blades, the normal line of the narrow plane was parallel to the radial direction of the furnace, shown in Fig. 3(c). Both groups were withdrawn at the rate of 200mm/h. Thermocouples were placed on the surface of a blade in Fig. 3(a) and (b) to record the temperatures. In Fig. 3(a), thermocouples 1 and 2 were placed on the blade surface at different height. In Fig. 3(b), thermocouple 3 was at outside, close to the furnace wall, and 4 was at inside, close to the center of the furnace;1 and 2 were placed along the center line of the blade surface at different heights.
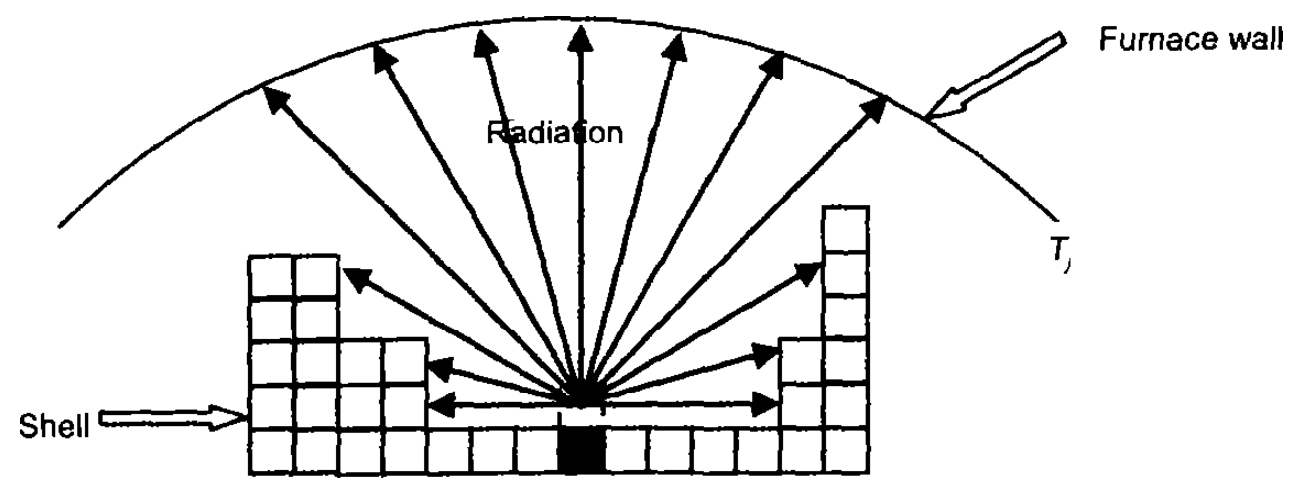
Fig. 2 Schematics for the calculation of heat radiation
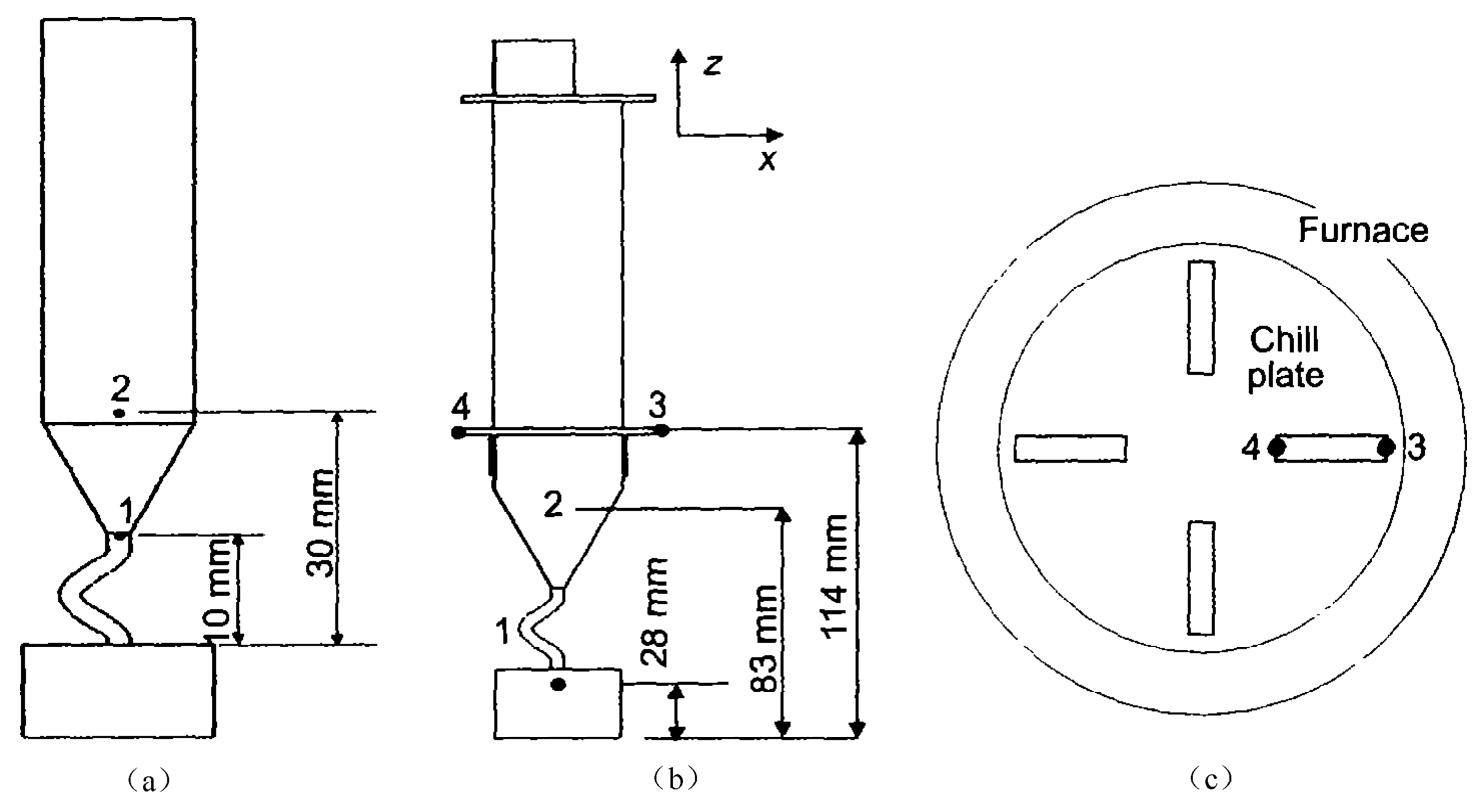
Fig. 3 Sketch of the thermocouple positions in the castings:(a) single blade, (b) multiple blades, (c) top view of multiple blades
Figure 4 shows the comparison between the experimental and calculated cooling curves of single blade. Table 1 shows quantitative comparison between simulation and experimental results of single blade. From Fig. 4 and Table 1, it can be seen that the calculated cooling curves agreed well with the experimental ones and the maximum error between the experimental data and calculation is less than 5%.
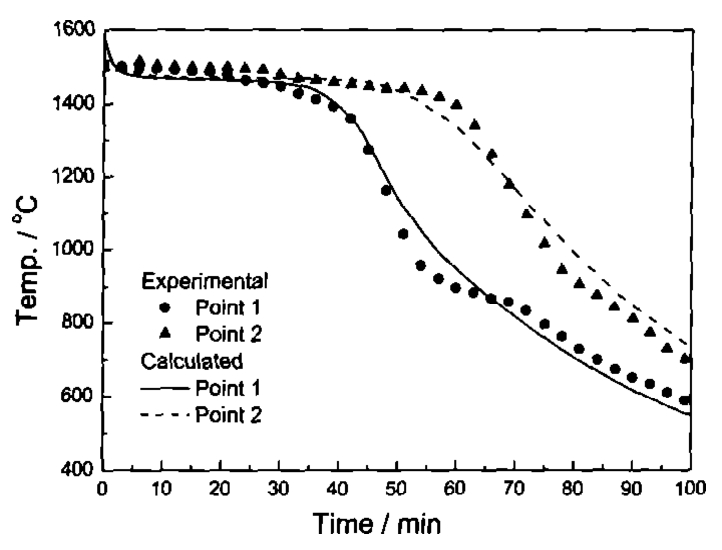
Fig. 4 Comparison between calculated and measuredcooling curves of single blade at points 1 and 2
Figure 5 and Table 2 show the comparison between the experimental and calculated cooling curves of multiple blades at four positions. For the circle distribution of multiple blades, point 3 is close to the furnace and there is great heat radiation between outside of the blade and furnace both in heating zone and cooling zone, while point 4 is in the inside of the circle and faces other blades and the chill plate. As the blades are withdrawn with chill plate from heating zone into cooling zone, more radiation heat can dissipate from outside of the blades than the inside. Although the blade is geometrically symmetrical, the unsymmetrical heat boundary causes the great temperature difference between the different positions along the horizontal line. For multiple blades, points 1 and 2 are along the center line of the blade surface and different distance in vertical direction causes the temperature difference. The cooling curves demonstrate that the modeling results are very close to the experimental data, and the error between experimental data and calculation is less than 5%.
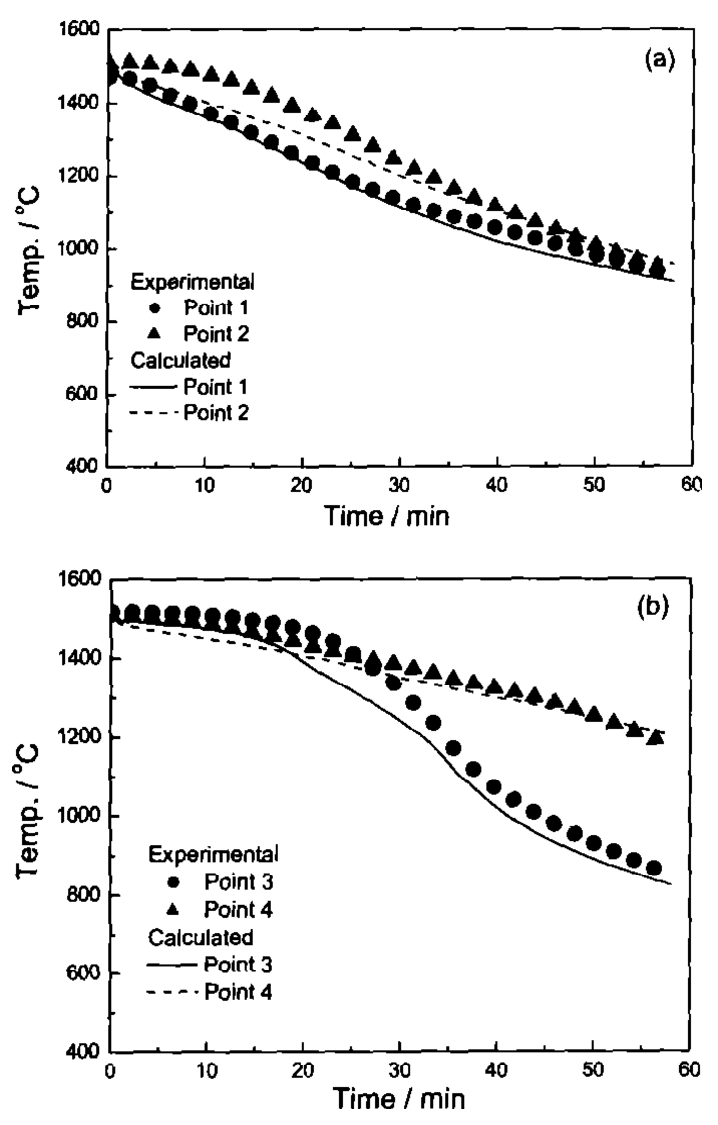
Fig. 5 Comparison between calculated and measured cooling curves of multiple blades: (a) points 1 and 2, (b) points 3 and 4
Figure 6 shows the temperature distribution of single blade at different solidification time. At current withdrawal rate, the solidification front was very flat, the temperature isothermal line along transverse section was flat, and there was almost no temperature difference. This will help to avoid the formation of the stray crystal.
Table 1 Comparison of calculated and experimental results of single blade

Notes: Exp.-experimental (℃), Cal.-calculated (℃), Err.-error (%)
Table 2 Comparison of calculated and experimental results of SX blade

Figure 7 shows the variation of the longitudinal temperature gradient. From the modeling results we can see that the longitudinal temperature gradient in the mushy zone, which appears near the baffle, is larger than in the liquid metal. The temperature gradient is almost flat in the transverse section with the temperature distribution.
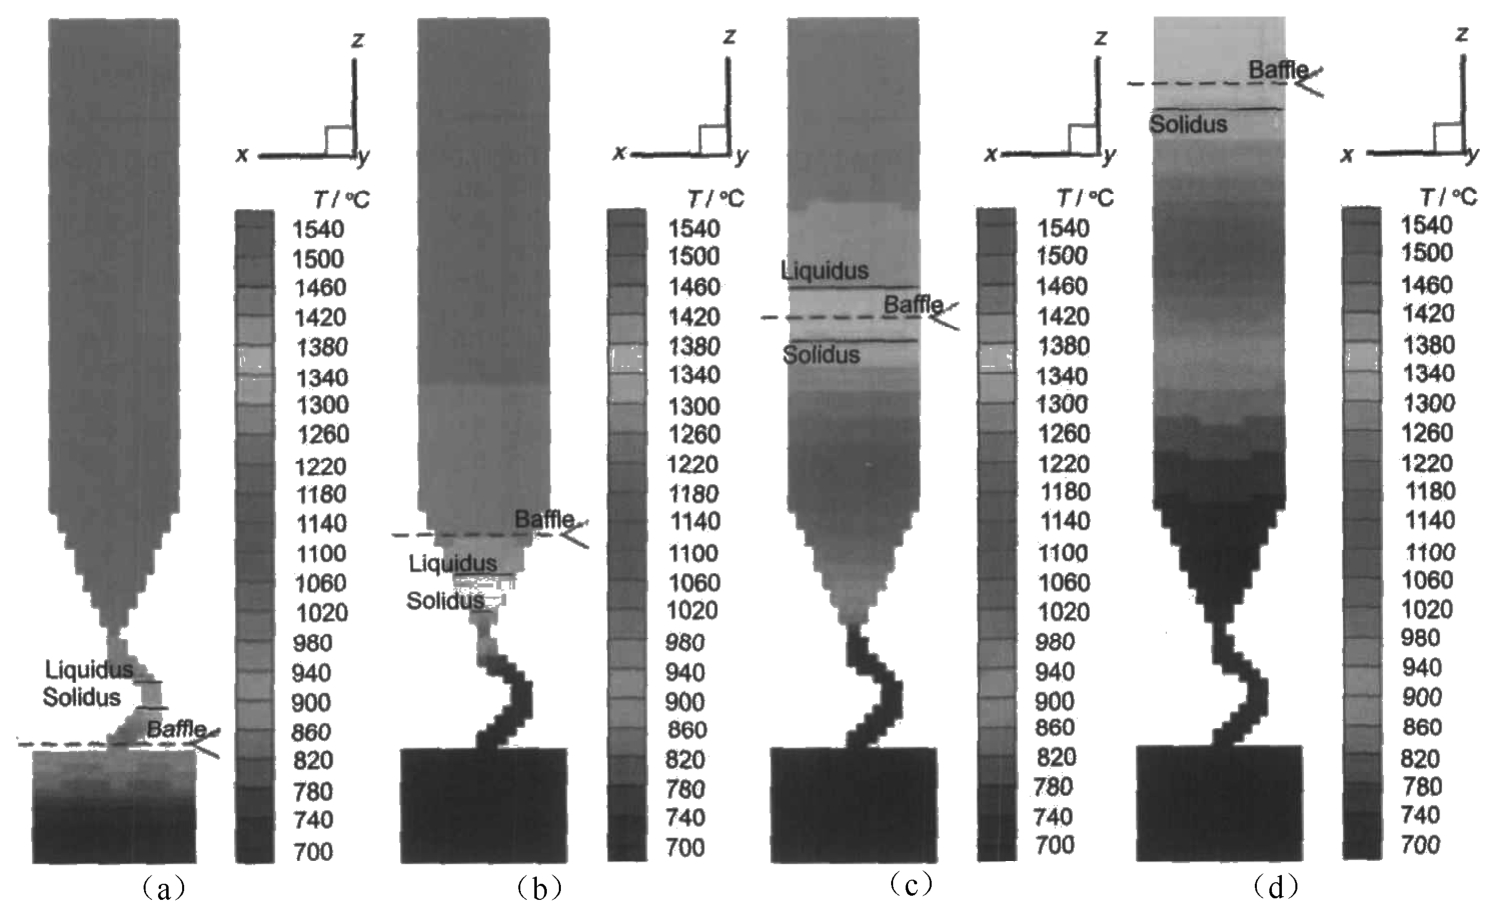
Fig. 6 Temperature distribution of single blade at different solidification time:(a) 25min, (b) 50min, (c) 75min, (d) 100min
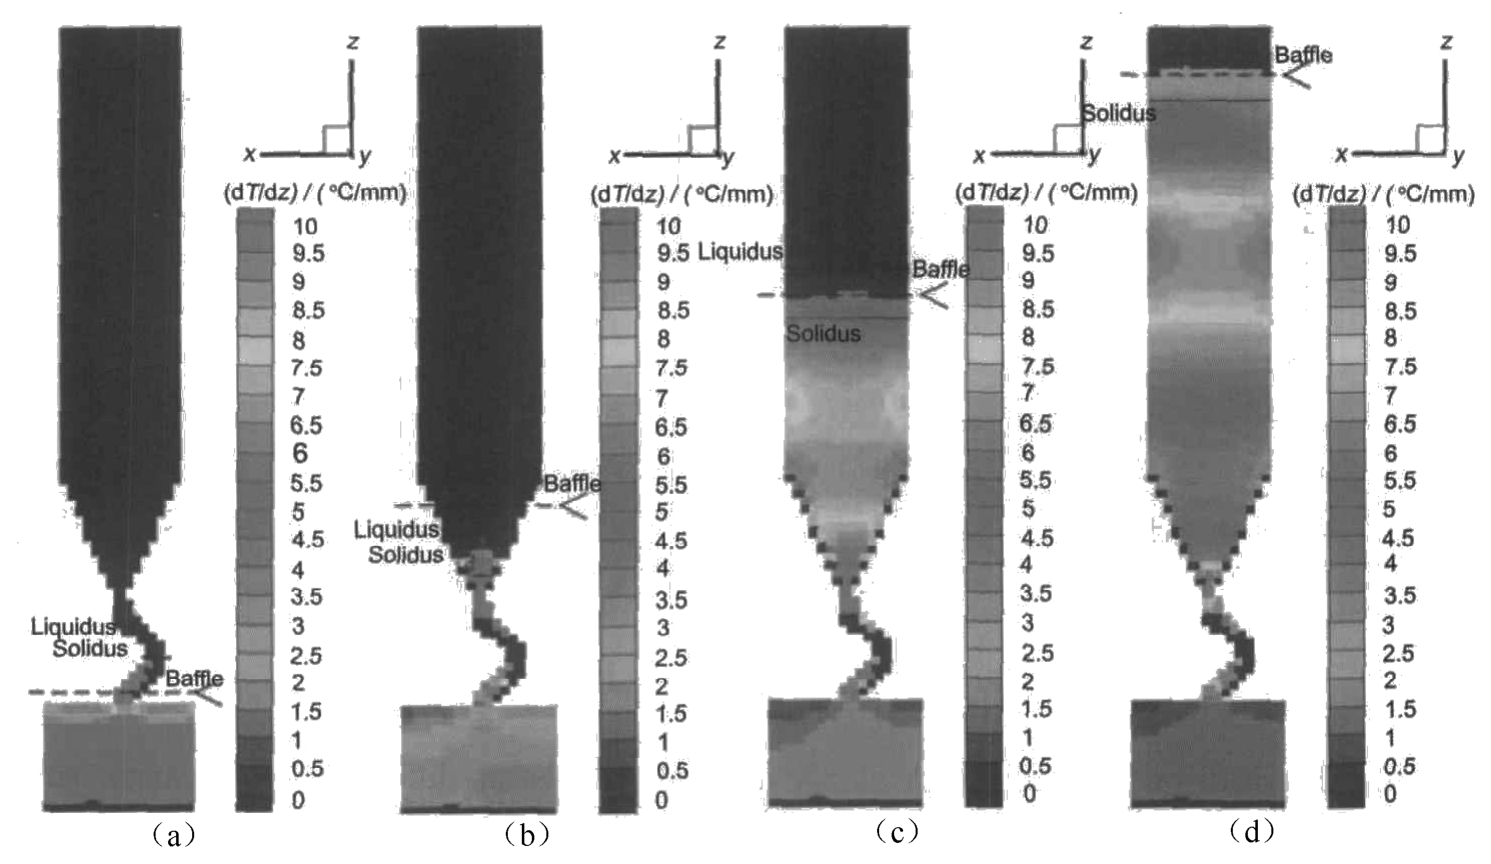
Fig. 7 Temperature gradient distribution of single blade at different solidification time:(a) 25min, (b) 50min, (c) 75min, (d)100min
Figure 8 is the temperature distribution of multiple blades in solidification process at the withdrawal rate of 200mm/h. It can be seen that the isothermal lines are not horizontal compared with the single blade. The temperature of the right side of the blade below the baffle, which is close to furnace wall, is much lower than that of the left side which is close to the center of the furnace. This is due to the interaction among the multiple blades. In the cooling zone stronger radiation exists between the outside of the blade and furnace wall than that between the inside and the furnace wall because of the baffled action of other blades. But in the heating zone the outside is close to the heating unit of the furnace and could keep the high temperature. The inside of blade in the heating zone could hardly be heated directly by the furnace wall. On the other hand the inside of the blade in the heating zone is influenced by the shell mold covering the whole chill plate. The shell mold on the chill in the middle of the furnace has low temperature because of the heat conduction between the shell mold and the chill plate.
Figure 9 is the longitudinal temperature gradient distribution of the multiple blades during the solidification at the withdrawal rate of 200mm/h. It can be found that the maximum gradient is located at the right side of the blade, i . e . the maximum x value. Compared with the single blade case, the temperature gradient is not symmetrical.
Figure 10 shows the temperature distribution of the starter block and grain selector of multiple blades. The model′s screw part which links the body and starter is grain selector. For single crystal blade, lots of nucleus with different orientations formed after the melt was poured into the shell placed on the chill. The nucleus whose preferential growth direction is parallel to the maximum temperature gradient grows faster than others. After the competitive growth of grains in grain selector, only one grain can grow out from the top of selector and fill the body ideally in the end. When the only grain grows into the body, the temperature difference between the different positions along horizontal line can cause nucleation somewhere, as the undercooling of the liquid reaches a critical value. This may be the main reason why the stray crystal forms.
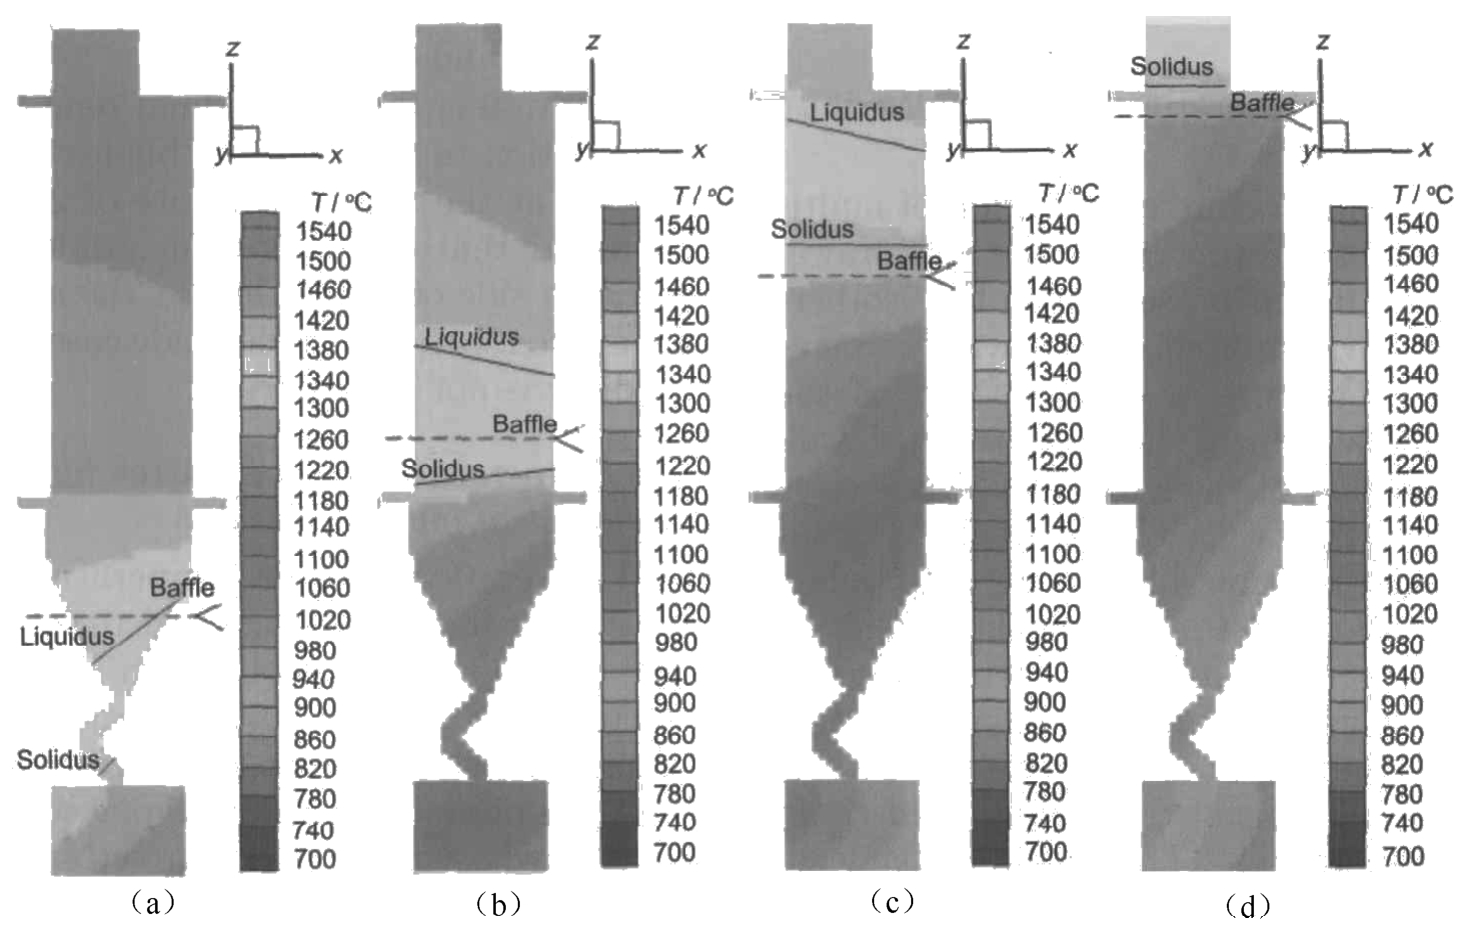
Fig. 8 Temperature distribution of SX multiple blades at different solidification time:(a) 15min, (b) 30min, (c) 45min, (d) 60min
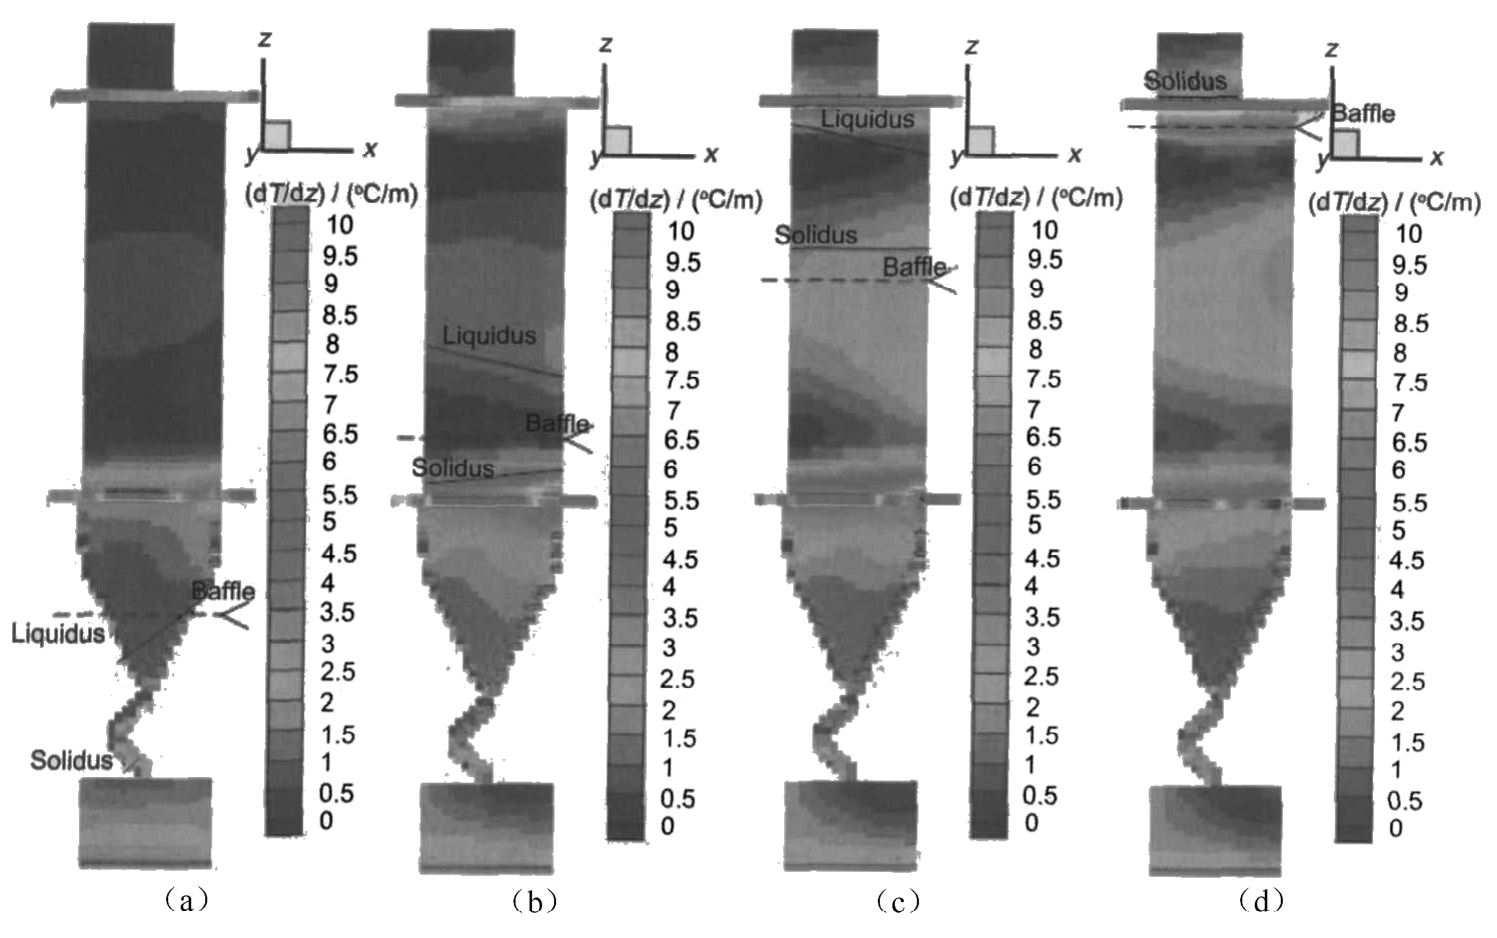
Fig. 9 Temperature gradient distribution of SX multiple blades at different solidification time:(a) 15min, (b) 30min, (c) 45min, (d) 60min
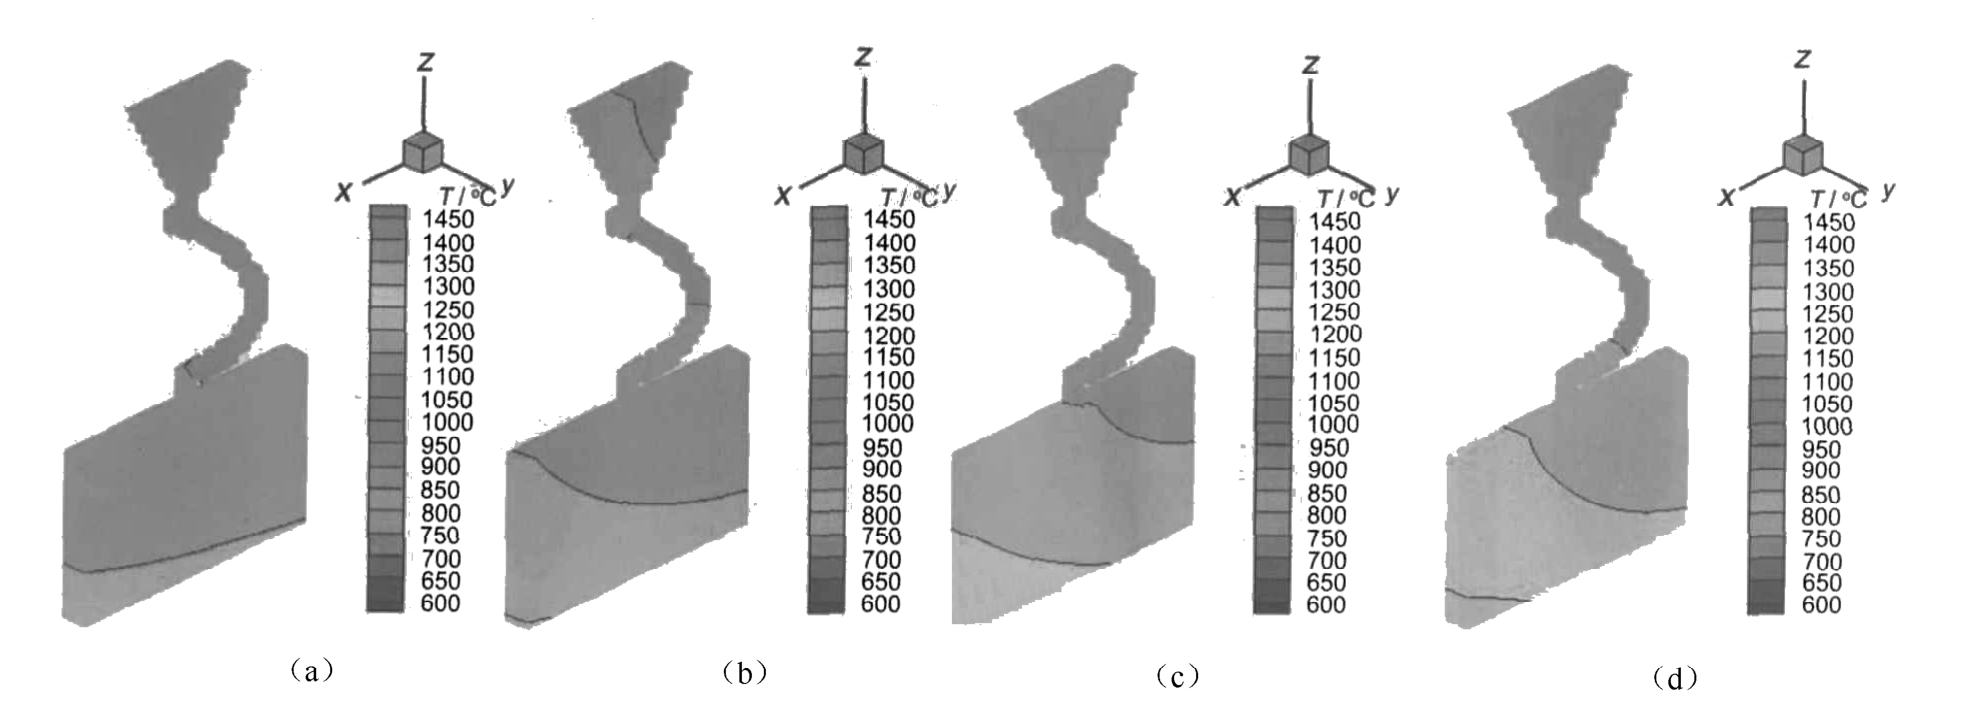
Fig. 10 Temperature distribution of start block of SX multiple blades at different solidification time:(a) 5min, (b) 10min, (c) 15min, (d) 20min
To decrease and avoid the casting defects especially the stray grain, great efforts should be done to change and reduce the influence of unsymmetrical temperature distribution. We can take some measures as follows:(1) Reflector should be placed between every two blades to decrease the interaction; (2) To avoid the nucleation of new grain, the various withdrawal rate should be used. The blade casting can be withdrawn slowly when the transitional region passes the baffle; (3) For the blade with thin body, the normal line of the wide plane of the blade should be parallel to the radial direction of the furnace and towards the furnace instead of towards other blades. The suggested placement of multiple blades on chill plate was shown in Fig. 11.The temperature difference along the horizontal line could be decreased.
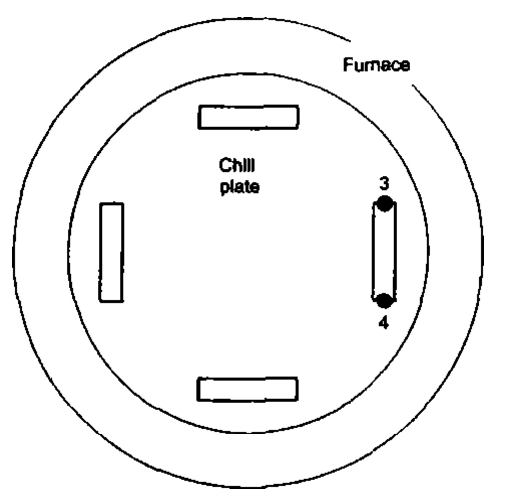
Fig. 11 Proposed placement of multiple blades on the chill plate
Figures 12 and 13 show the temperature and temperature gradient distribution of multiple blades with the proposed distribution of blades as shown in Fig. 11 on the chill plate. Compared with previous distribution the blades rotate 90° along z -axis. The normal line of the wide plane points to the center of the furnace. It can be seen that the temperature and temperature gradient distribution are similar to that of the single blade and the isothermal is almost horizontal. The maximal temperature gradient appears at the liquid-solid interface evenly. This temperature is suitable for the production of single crystal compared with the previous results of multiple blades. The simulation results show that changing the distribution of blades is an effective way for multiple blades investment castings.
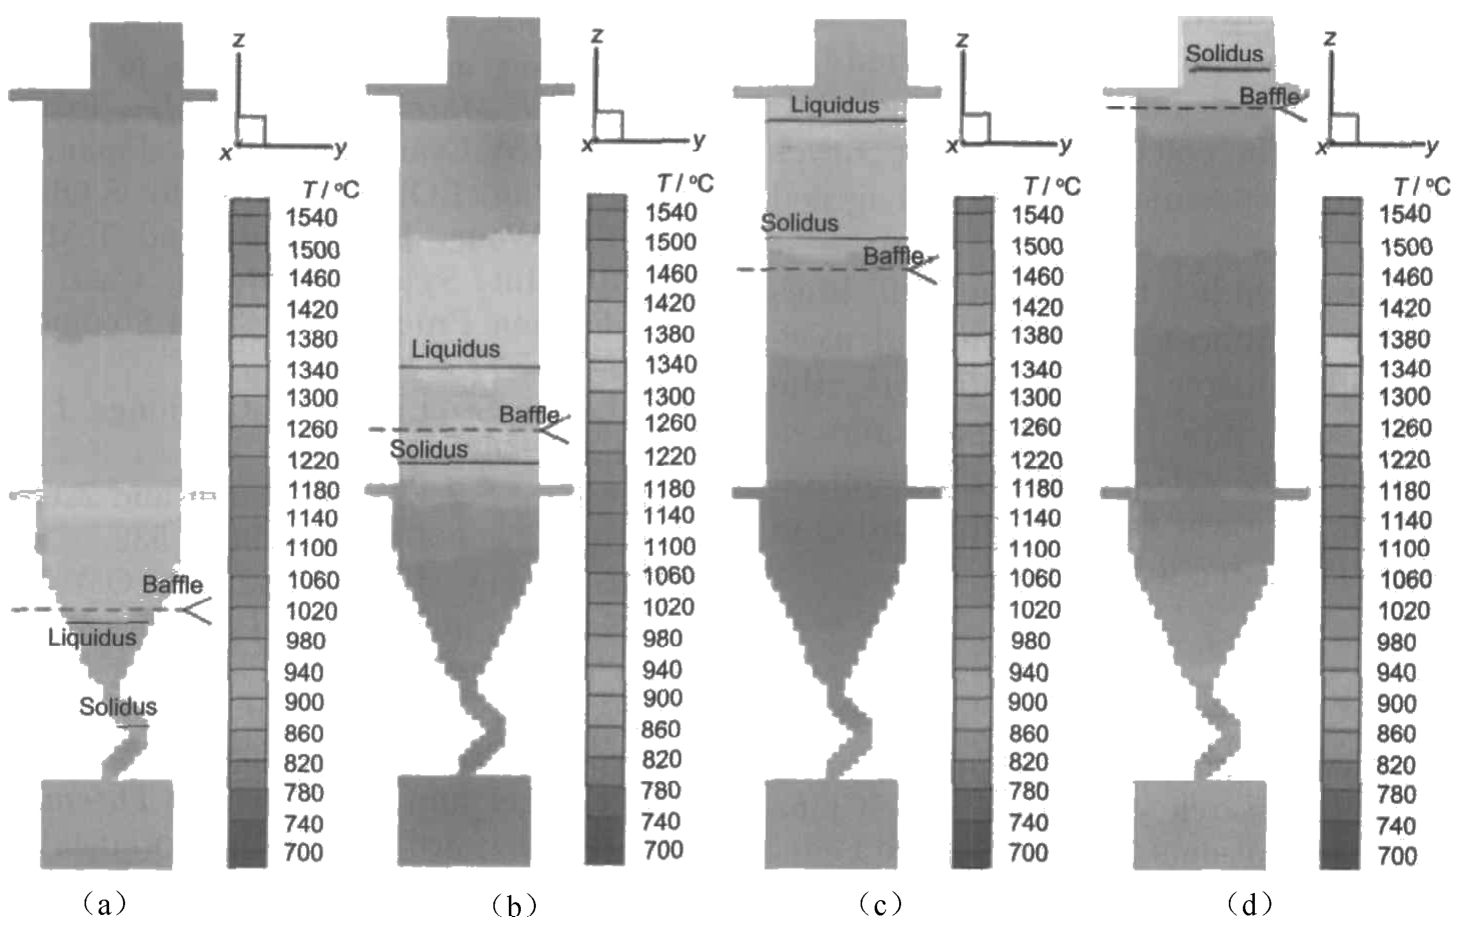
Fig. 12 Temperature distribution of multiple blades at different solidification time with modified blades distribution in Fig. 11:(a) 15min, (b) 30min, (c)45min, (d)60min
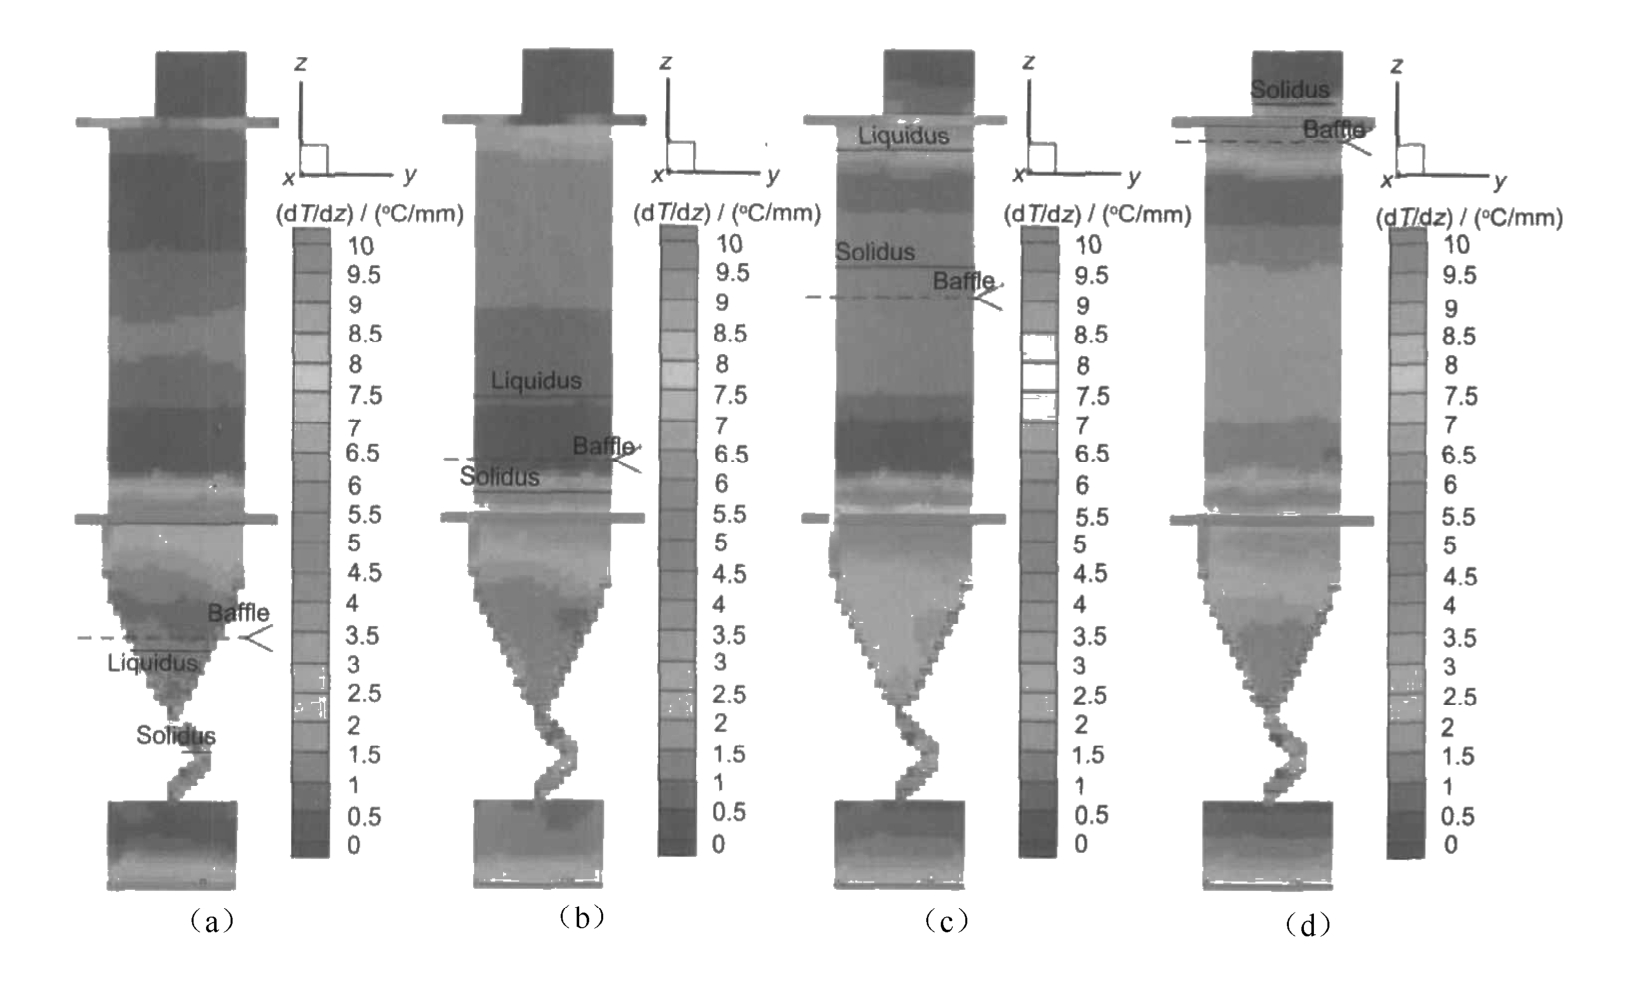
Fig. 13 Temperature gradient distribution of multiple blades at different solidification time with modified blades distribution in Fig. 11:(a) 15min, (b) 30min, (c) 45min, (d) 60min
(1) A mathematical model for 3D simulation of directional solidification of multiple turbine blades was developed based on basic heat transfer equations and consideration of radiative heat transfer.
(2) The numerical modeling has been carried out for the solidification process of single blade and multiple ones, respectively. The calculated cooling curves were compared with the experimental ones and agreed well with the latters.
(3) For the single blade, the isothermal lines and growth interface is almost horizontal and axis-symmetrical. For the multiple blades, however, the isothermal lines and solid/liquid interface are uneven to some extent. The blades with circular distribution on the copper plate have lower temperature and cool faster at the outside than inside.
This research was financially supported by the National Basic Research Program of China (No. 2005CB724105), the National Natural Science Foundation of China (No. 10477010) and Tsinghua-IHI Research Funds.
[1]W. R. Wilcox: J . Cryst. Growth ,1980, 48 ,416.
[2]R. J. Naumann: J . Cryst. Growth ,1982, 58 ,554.
[3]T. Jasinski: J . Cryst. Growth ,1983, 61 ,339.
[4]T. Jasinski and R. J. Naumann: J . Cryst. Growth ,1984, 66 ,469.
[5]K. O. Yu, M. J. Beffel, M. Robinson, D. D. Goettsch, B. G. Thomas, D. Pinella and R. G. Carlson: Trans. Am. Found. Soc .,1990, 53 ,417.
[6]K. O. Yu, J. A. Oti, M. Robinson and R. G. Carlson:in Proc. 7th Int. Symp. on Superalloys , eds. S. D. Antolovich, R. W. Stusrud, R. A. MacKay, D. L. Anton, T. Khan, R. D. Kissinger and D. L. Klarstrom, Champion, PA, USA, 1992, 135.
[7]M. Saitou and A. Hirata: J . Cryst. Growth ,1991, 113 ,147.
[8]L. M. Galantucci and L. Tricarico: J . Mater. Process. Technol. ,1998, 77 ,160.
[9]D. Wang and R. A. Overfelt:in Proc. Conf. Compu. Model. Mater. , Min. and Met. Process. , eds. M. Cross and J. W. Evans, San Diego, Japan, 2001, 461.
[10]J. D. Zhu, I. Ohnaka, K. Kudo, S. Obara, A. Kimatsuka, T. M. Wang, F. Kinoshita and T. Murakami:in Proc. 10th Int. Symp. on Model. Cast. Weld. Adv. Solidification Process. , ed. D. M. Stefanescu, U. S. A.,2003, 447.
[11]J. R. Li, S. Z. Liu and Z. G. Zhong: J . Mater. Sci. Technol. , 2002, 18 (4),315.
[12]J. R. Li, S. Z. Liu, H. L. Yuan and Z. G. Zhong: J . Mater. Sci. Technol. ,2003, 19 (6),532.
[13]Z. J. Liang, J. R. Li, B. C. Liu, Q. Y. Xu, H. L. Yuan and S. Z. Liu:in Multiph. Phenom. Model. Simul. Mater. Process. , eds. TMS, Charlotte,2004, 227.
[14]Weiheng JIANG: Heat Transfer 1st ed., Higher Education Press, Hebei, 1989, 172-190. (in Chinese)
[15]R. Siegel and J. R. Howell: Thermal Radiation Heat Transfer , 3rd ed., Braun-Brumfield, Inc., USA, 1992.