

Measurement is to compare the measured quantity with the standard ones. Through comparison, it can be determined that the measured value is equal to several times of the measurement unit, which is combined with the multiple to show the measured value. Therefore, both the magnitudes and units of measurement value are indispensable. For example, by comparing the length of a table with that of a meter ruler, the length of the table is measured to be 1.528 meters; by comparing the weight of an iron with the counterweights, the mass of the iron block is measured to be 35.87 grams.
(1) According to the principle of measurement, it can be classified into direct measurement and indirect measurement.
Direct measurement refers to a measurement in which an object is measured by direct compari son with the instrument without auxiliary calculation. For example, weighing mass with a balance,measuring length by using a meter ruler, measuring time through a clock, etc.
Indirect measurement means a measurement in which a value is calculated by using one or several physical quantities through the given function relations.
(2) Classification based on the frequency of measurements
Measurements can be classified as single measurements and multi-measurements. Specifically,multi-measurement is categorized as equal precision repeating measurement and unequal precision repeating measurements.
Single measurement means that one physical quantity is measured for only one time. For example, the specific heat capacity of solid or liquid can not be measured for more than once because the equilibrium temperature passes in a moment.
Equal precision multi-measurement means that the same measurer with the same instrument and method, in the same environment, measures the physical quantity several times repeatedly to take the average as the result.
Unequal precision multi-measurement means that in the measurement of the same physical quantity, if one or several factors ( instruments, methods, operators, external conditions, etc. ) have changed, the accuracy of measurement would alter. The weighted average value of each measurement is taken as the result. Usually, the single measurement and equal precision multi-measurements are adopted in experiments.
Measuring instruments refer to all instruments used for direct or indirect measurement of the measured quantity value. For example, balance, stopwatch, ammeter, voltmeter, power supply and so on.
Selection of measuring instruments:
(1) Choosing the appropriate measuring range. If the measured value exceeds the measuring range of the instrument, the instrument may be damaged; if the measuring range gets too wide for unapparent readings then errors might increase.
(2) Selecting an instrument with an appropriate level of accuracy. Generally, when meeting the measurement requirements, select the instruments with a low level of accuracy in order to prolong the service life of the instruments with a high level of accuracy.
Measurements are made with the instrument as standard for comparison, which requires the ac curacy of instruments. However, due to the different purposes of measurement, the requirements for the accuracy level of the instruments are also different. For example, the balance for weighing platinum is accurate to 0.001 g, while it does not matter if the error of weighing carbon comes at dozens of grams.
True value is independent of human will, and is expressed by the letter“a”. The magnitude obtained by direct or indirect measurement is called the observed value (measured value). Due to measurement tools, technical methods, environmental conditions and other reasons, the experimental results are more likely to be uncertain. Therefore, there are always differences between the true value and the experimental results.
1) Errors
The deviations between measured values (experimental result) x and true values a are called errors, which are represented by “ ε ” and can be positive or negative.
2) Causes of errors
① Theoretical approximation and hypothesis.
② Accuracy of instruments.
③ Experimental apparatus.
④ Changes of experimental condition.
⑤ Observers.
3) Classification of errors
According to the nature of their influences, errors can be divided into systematic errors and random errors.
(1) Systematic error : when the same physical quantity is measured many times under the same condition, the value and symbol of the error always remain unchanged or change depending on certain rules. The causes are as follows:
① Instrumental error: it is caused by manufacturing defects, improper use or non-calibration of instruments. For example, inaccurate mass of weights, unequal arms of the balance, inaccurate zero point of the meter, etc.
② Theoretical and methodological error: inadequate principle or method of measuring the theoretical formula approximation, experimental conditions and methods failing to meet the requirements perfectly are all causes of error. In experiments, this sort of errors is likely to derive from mistakenly ignored factors as follows: frictional resistance, wire and contact resistance and heat dissipation.
③ Error of device: errors caused by improper arrangement, installation or adjustment of the measuring devices, both circuital and optical paths.
④ Artificial error: error caused by habits, psychological or physiological characteristics of the measurer like pressing the stopwatch too fast or too slowly.
There are some methods to reduce systematic error, such as improve the accuracy of experimental instruments, revise the theoretical formula, modify the experimental conditions and improve our experimental skills and techniques.
(2) Random error (accidental error): when repeating the measurement of a certain physical quantity under the same conditions, the measurement results “jump” around a certain value rather than staying the same. And the value and symbol of the error change indeterminably.
The law of accidental error and its probability characteristics:
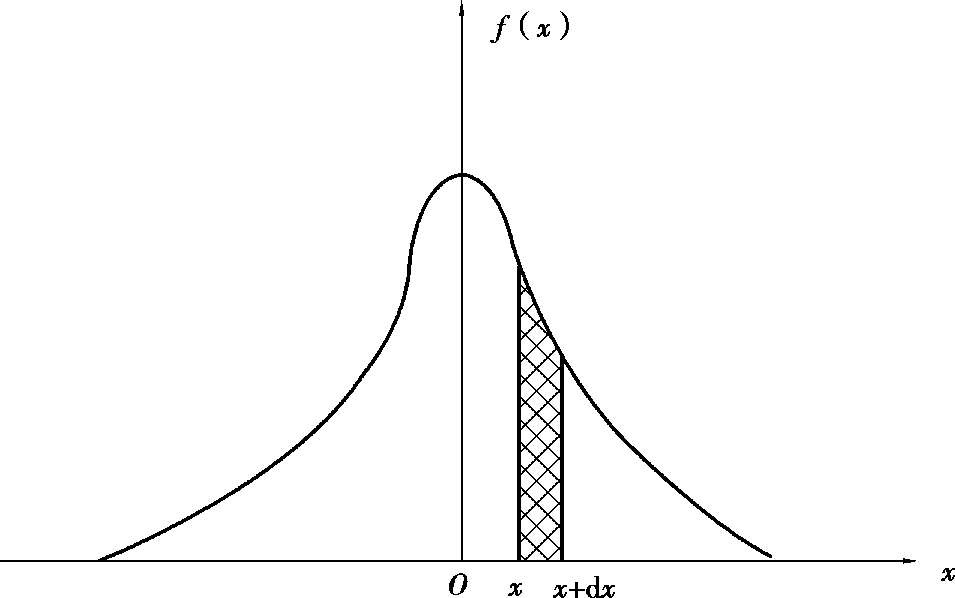
According to the statistical analysis of a large number of experimental data, the accidental error obeys certain laws of probability distribution when multiple observations are carried out under the same condition. The most common ones are Gaussian distribution (normal distribution) and t distribution (please refer to some books about error theory). The Gaussian distribution curve is shown in Figure 1.1.1. The horizontal axis x is the accidental error of measurement, and the vertical axis f ( x ) is the probability density of the error. The cell area of f ( x ) d x under the curve, or the shadow part, is the probability of occurrence of errors from x to x + d x . The function f ( x ) is derived by Carl Friedrich Gauss (1777-1855).

Where
σ
is the standard error and e is the base of the natural logarithm. If the precision index is set at
h
= 1 /(
 ·
σ
), then


Figure 1.1.1 Gauss distribution curve
When
x
= 0,
f
(0)=
h
/
 = 1 /(
 π
σ
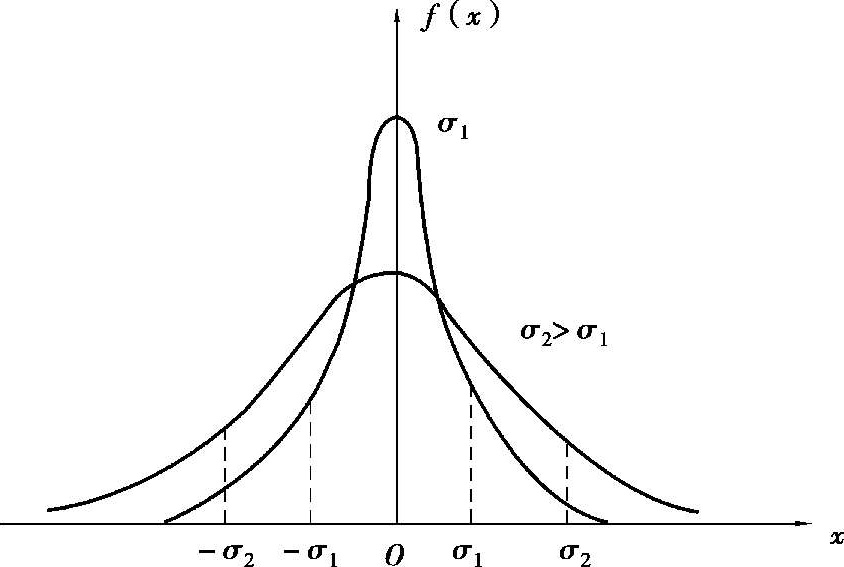
). Therefore, the smaller the
σ
is, the bigger the
f
(0) is. The steeper the error distribution curve is, and the more concentrated the data is ( that is the greater the precision index
h
, the higher the measurement precision). As shown in Figure 1.1.2.

Figure 1.1.2 Gauss distribution curves with different σ
From the distribution curve of accidental error, the error possesses these probabilistic charac teristics:
① Unimodality: the smaller the absolute value of error is, the greater the probability of error occurrence becomes. Conversely, the greater the absolute value is, the smaller the probability of error is.
② Symmetry: when the absolute values of errors are equal, the probabilities of occurrence of errors are equal.
③ Boundedness: the probability of error with a large absolute value is almost equal to zero,that is to say, it seldom occurs. Meaning the accidental error will not exceed a certain limit under given conditions.
④ Causes: many unexpected accidental factors cause these errors.
There are some reduction methods, such as increase the times of measurements and take the arithmetic mean value of multiple equal precision measurement columns as the result.
According to different calculation methods, they can be divided into absolute errors and relative errors.
(1) Absolute error: referring to the difference between the measured value x i and the true value a . The arithmetic mean of multiple equal precision measurement columns is taken as the true value.

(2) Relative error: representing the percentage ratio of the absolute value of the absolute error to the true value:
