


Fig. 1-2 shows an atomic (010) slice of the Cu wire and substrate during the loading and unloading processes. An attractive force between the wire and substrate is observed when the wire is close to the substrate, which displays the bulging of the substrate surface atoms under the wire tip, as shown in Fig. 1-2(a). The attraction force increases with the decrease of the distance between the substrate and wire. The substrate surface atoms are rapidly contacted by wire atoms, as shown in Fig. 1-2(b). As the wire continues to press downward, the repulsion between the substrate and wire becomes the main force. Because the substrate atoms are compressed at the lower end of the wire, the atomic lattice begins to deform and the strain energy increases. When the repulsion exceeds a certain value, the lattice structure breaks, and the substrate atoms start to rearrange and the strain energy is released, as shown in Fig. 1-2(c). During the unloading process, the main force acting on the substrate atoms changes from repulsion to attraction. Upon retraction of the wire away from the substrate surface, a small portion of the substrate atoms adhere to the indenter surface, as shown in Fig. 1-2(d). Continuing the retraction of the wire, a neckband is formed between the indenter and substrate, as shown in Fig. 1-2(e). At the time of 484 ps, the wire separates from the substrate, as shown in Fig. 1-2(f).
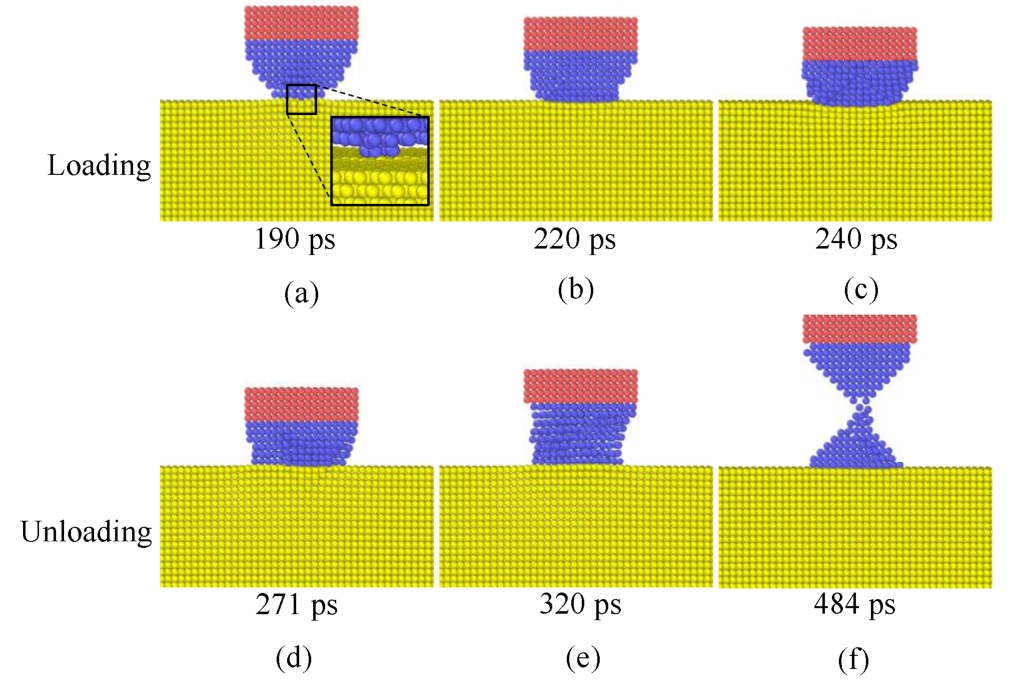
Fig. 1-2 Atomic (010) slice of the Cu wire and substrate during the loading and unloading processes
The variations of the Cu wire load force versus the model indentation displacement are shown in Fig. 1-3, which consists of the loading curve and unloading curve. During the initial contact stage, in which the indentation displacement is-3.6 Å, the attractive force between the wire and substrate appears, and increases significantly. This instability corresponds to the jump-to-contact (JC) phenomenon [26] . During the JC process, the kinetic temperature of the system increases due to the bulging of the surface atoms, then this temperature rise is dissipated to the ambiance through stochastic collisions. At the onset of contact formation, in which the tip approach is-0.75 Å, the maximum attractive force reaches a value of 23.5 nN. As the indentation displacement continues to increase, the repulsive force increases and becomes the main force. When the indentation displacement equals 2.32 Å, the contact load is approximately zero, the attractive and repulsive forces between the wire and substrate achieve the equilibrium point. Further indenting the wire to the substrate, the contact load increases linearly by increasing the indentation displacement. When the indentation displacement reaches 4.50 Å, it meets the yielding point and the plastic deformation starts. During the unloading process, the repulsive force considerably decreases and changes to attractive force as the indentation displacement reaches 4.57 Å. The loading and unloading curves do not coincide, the unloading curve presents hysteresis. This is explained by the wire indenter retraction away from the substrate; a neckband forms and breaks between the indenter and substrate because of the adhesion force, as shown in Fig. 1-2(f).
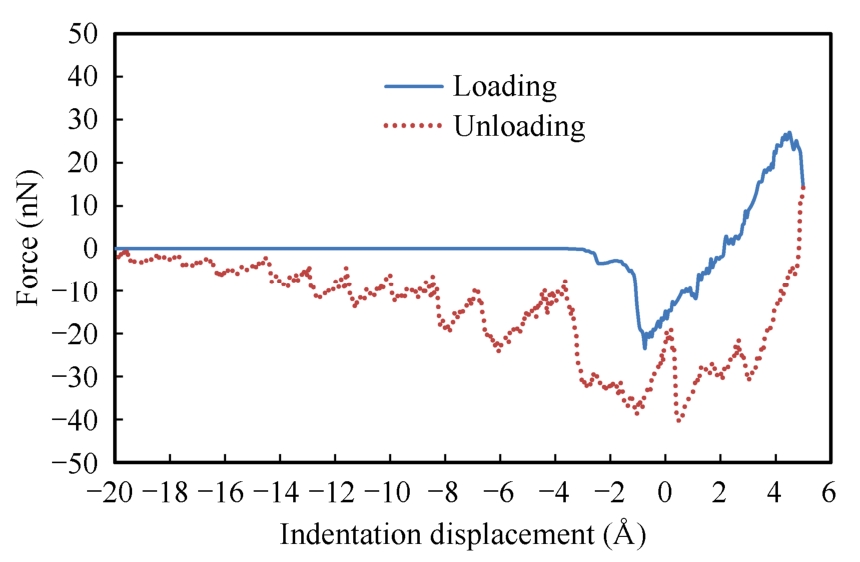
Fig. 1-3 The variations of the Cu wire load force versus the model indentation displacement
To evaluate the deformation behavior of the contact surface, the indentation morphology at the atomic level is investigated. Fig. 1-4 shows atomic (010) slice of the indentation morphologies during the loading and unloading processes. The color change corresponds to the change in atomic displacement. Blue color represents atoms without movement (0 Å), and red color represents atoms that move furthest (1 Å). Atoms near the contact region of the wire and substrate change from blue to red, indicating the generation of deformations. Corresponding to the load force of the Cu wire versus the indentation displacement curve, when the indentation displacement reaches-1.0 Å, the attractive force makes the atoms on the surface bulging and bonded together. With the increase of the indentation displacement, the repulsive force increases, and the attractive force decreases; therefore, the atomic displacement decreases. For the substrate, when the indentation displacement reaches 2.6 Å, the atomic displacement of the substrate reaches approximately 0 Å, due to the equilibrium of the attractive and repulsive forces. After that, the substrate atomic displacement increases by increasing the indentation displacement. For the wire, the atomic displacement of the wire first increases because of the attractive force. Thus, it reduces because of the attraction and repulsion equilibrium. After the indentation displacement reaches 2.6 Å, dislocations in the middle area of the Cu wire slice are observed and the atomic displacement of the wire increases by increasing the indentation displacement.
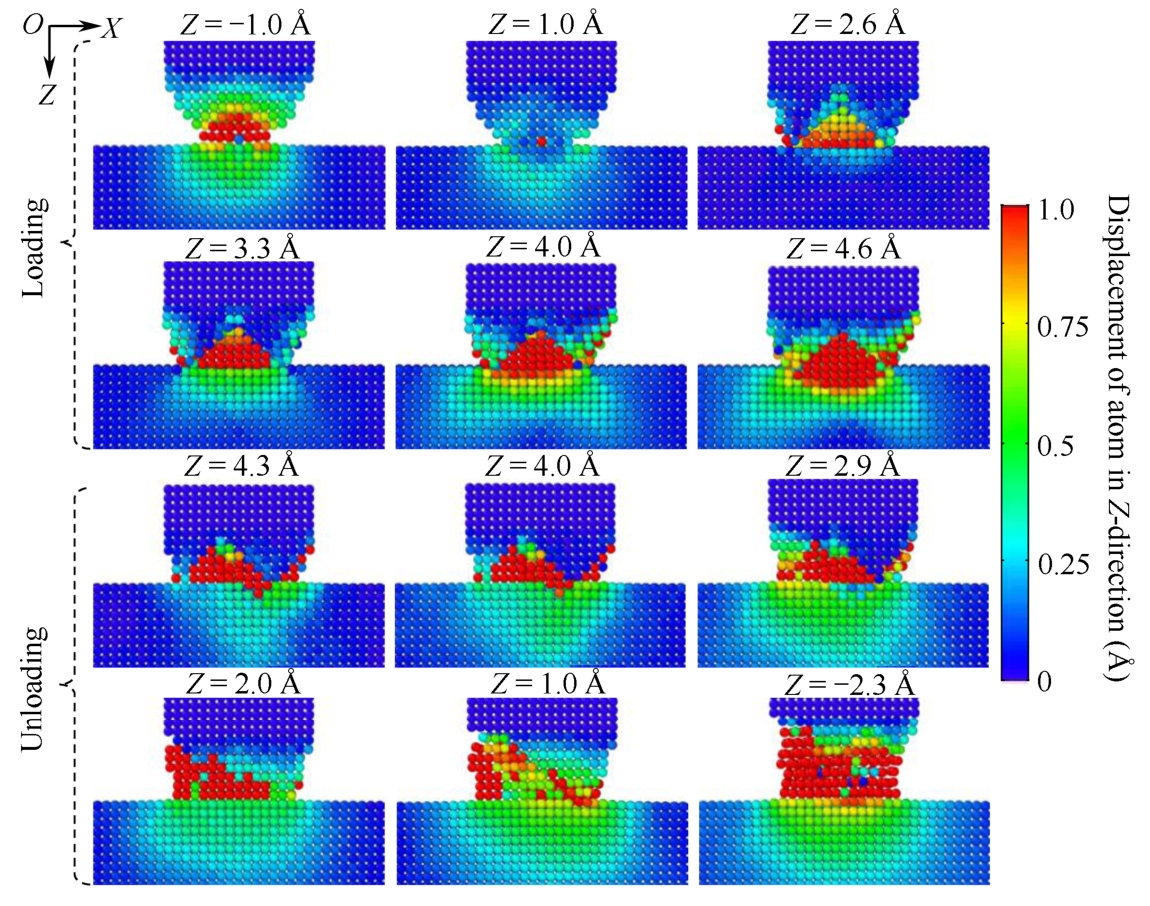
Fig. 1-4 Atomic (010) slice of the indentation morphologies during the loading and unloading processes
During the unloading process, the total force acting on the substrate atoms changes from repulsion to attraction with the continuation of the unloading. The repulsive force at the indentation displacement of 4.3 Å is smaller than that of 4.6 Å. Moreover, the substrate deformation near the contact region at the indentation displacement of 4.3 Å is smaller than that of 4.6 Å. There are still dislocations in the wire at the indentation displacement from 4.3 Å to 2.9 Å. By continuing to retract the wire, the main force changes to an attractive force. The deformation of the substrate near the contact region increases by increasing the attractive force. At the indentation displacement of 2.0 Å, wire atoms start to rearrange, the strain energy is released, and the deformation of the substrate near the contact region reduces. At the indentation displacement of 1.0 Å, the strain energy in the wire fails to rearrange the atoms, and dislocations are generated in the atomic lattice. After retracting the indentation displacement to-2.3 Å, a neckband is formed between the wire and substrate. The deformation near the contact region increases by increasing the attractive force.
Fig. 1-5 shows contours of von Mises stress on the slice of atomic (010). During the loading process, the main force acting on substrate atoms changes from attraction to repulsion. For the substrate, an indentation displacement of-1.0 Å is observed. The maximum von Mises stress on the substrate is under the wire and close to the surface. This is because the attractive force between the wire and substrate appears and increases significantly during the initial contact stage. As the indentation displacement continues to increase, the equivalent von Mises stress at the contact edges of the substrate is higher than that at the center of contact. For the wire, after the indentation displacement reaches 2.8 Å, dislocations in the middle area of the Cu wire are observed. Therefore, the stress concentration occurs around dislocations.
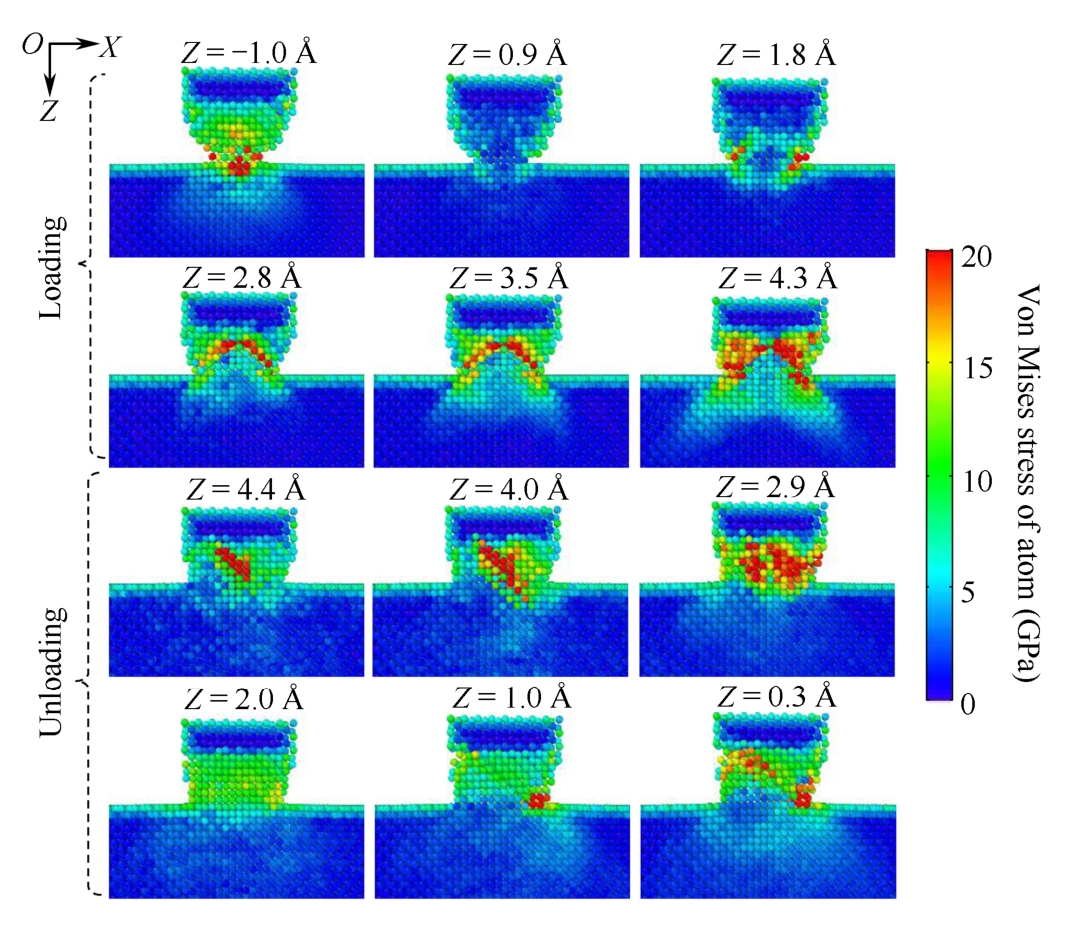
Fig. 1-5 Contours of von Mises stress on the slice of atomic (010)
During the unloading process, the equivalent von Mises stress value in the substrate first reduces and then increases. This is because the total force acting on the substrate atoms changes from repulsion to attraction with the continuation of the unloading. Stress concentration is observed in the wire because of the dislocations.
Fig. 1-6 shows the equivalent von Mises stress distribution along the line AA′ of the substrate during the loading and unloading processes. During the loading process, at the indentation displacement of-1.0 Å, the maximum von Mises stress is under the wire tip; moreover, it is under the JC process and the main force is attractive. As the indentation displacement increases from 2.0 Å to 4.6 Å, the main force changes to a repulsive force. The maximum von Mises stress increases and shifts towards the edge of the contact area, as shown in Fig. 1-6(a). During the unloading process, the main force changes from repulsive to attractive. As retracting the indentation displacement from 2.9 Å to-2.6 Å, the main force is the attraction force, as displayed in Fig. 1-3. The maximum von Mises stress increases by increasing the attractive force. It is higher at the contact edges of the substrate than at the center of contact, as shown in Fig. 1-6(b). At the indentation displacement of-18.4 Å, a neckband forms and breaks between the wire and substrate. The minimum von Mises stress is observed under the wire tip, corresponding to the narrowest band.
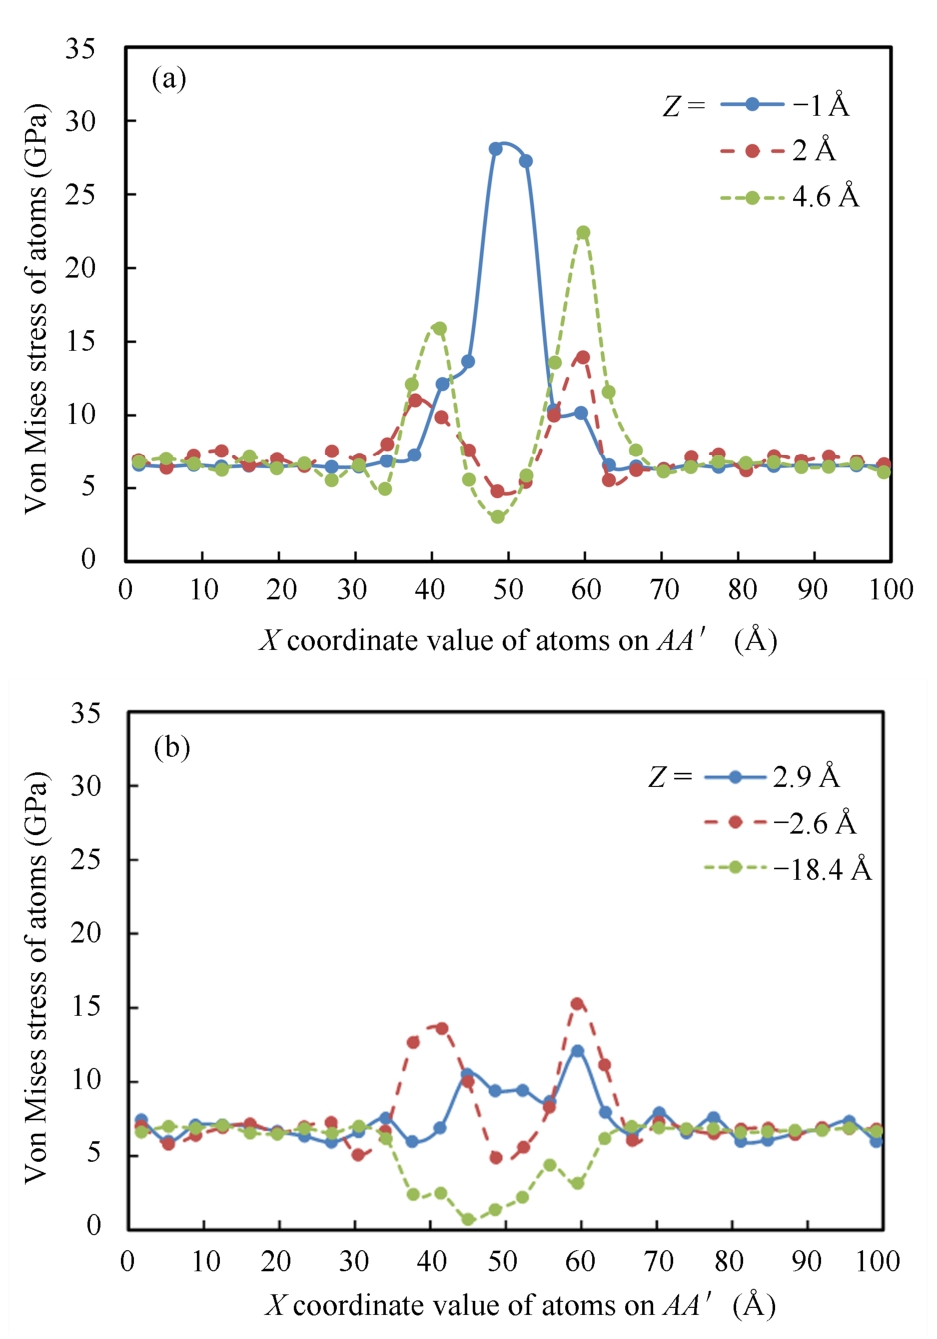
Fig. 1-6 Equivalent von Mises stress distribution along the line AA′ of the substrate during the
(a) loading process and (b) unloading process