

There are three premises on which the technical approach is based:
The statement“market action discounts everything”forms what is probably the cornerstone of technical analysis. Unless the full significance of this first premise is fully understood and accepted, nothing else that follows makes much sense. The technician believes that anything that can possibly affect the price—fundamentally, politically, psychologically, or otherwise—is actually reflected in the price of that market. It follows, therefore, that a study of price action is all that is required. While this claim may seem presumptuous, it is hard to disagree with if one takes the time to consider its true meaning.
All the technician is really claiming is that price action should reflect shifts in supply and demand. If demand exceeds supply, prices should rise. If supply exceeds demand, prices should fall. This action is the basis of all economic and fundamental forecasting. The technician then turns this statement around to arrive at the conclusion that if prices are rising, for whatever the specific reasons, demand must exceed supply and the fundamentals must be bullish. If prices fall, the fundamentals must be bearish. If this last comment about fundamentals seems surprising in the context of a discussion of technical analysis, it shouldn't. After all, the technician is indirectly studying fundamentals. Most technicians would probably agree that it is the underlying forces of supply and demand, the economic fundamentals of a market, that cause bull and bear markets. The charts do not in themselves cause markets to move up or down. They simply reflect the bullish or bearish psychology of the marketplace.
As a rule, chartists do not concern themselves with the reasons why prices rise or fall. Very often, in the early stages of a price trend or at critical turning points, no one seems to know exactly why a market is performing a certain way. While the technical approach may sometimes seem overly simplistic in its claims, the logic behind this first premise—that markets discount everything—becomes more compelling the more market experience one gains. It follows then that if everything that affects market price is ultimately reflected in market price, then the study of that market price is all that is necessary. By studying price charts and a host of supporting technical indicators, the chartist in effect lets the market tell him or her which way it is most likely to go. The chartist does not necessarily try to outsmart or outguess the market. All of the technical tools discussed later on are simply techniques used to aid the chartist in the process of studying market action. The chartist knows there are reasons why markets go up or down. He or she just doesn't believe that knowing what those reasons are is necessary in the forecasting process.
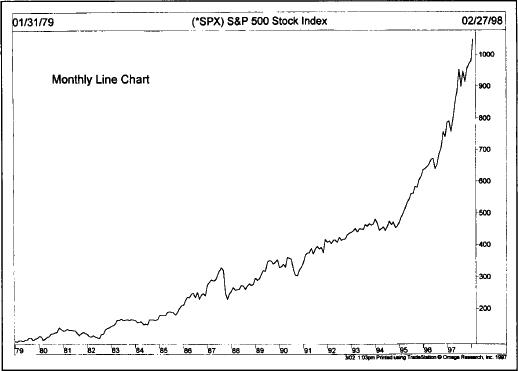
The concept of trend is absolutely essential to the technical approach. Here again, unless one accepts the premise that markets do in fact trend, there's no point in reading any further. The whole purpose of charting the price action of a market is to identify trends in early stages of their development for the purpose of trading in the direction of those trends. In fact, most of the techniques used in this approach are trend-following in nature, meaning that their intent is to identify and follow existing trends. (See Figure 1.1 .)

Figure 1.1 Example of an uptrend. Technical analysis is based on the premise that markets trend and that those trends tend to persist.
There is a corollary to the premise that prices move in trends— a trend in motion is more likely to continue than to reverse. This corollary is, of course, an adaptation of Newton's first law of motion. Another way to state this corollary is that a trend in motion will continue in the same direction until it reverses. This is another one of those technical claims that seems almost circular. But the entire trend-following approach is predicated on riding an existing trend until it shows signs of reversing.
Much of the body of technical analysis and the study of market action has to do with the study of human psychology. Chart patterns, for example, which have been identified and categorized over the past one hundred years, reflect certain pictures that appear on price charts. These pictures reveal the bullish or bearish psychology of the market. Since these patterns have worked well in the past, it is assumed that they will continue to work well in the future. They are based on the study of human psychology, which tends not to change. Another way of saying this last premise—that history repeats itself—is that the key to understanding the future lies in a study of the past, or that the future is just a repetition of the past.