
下载掌阅APP,畅读海量书库
立即打开


 Resonance Raman Spectroscopy of the Photoreceptor-like Pigment of
Halobacterium halobium
Resonance Raman Spectroscopy of the Photoreceptor-like Pigment of
Halobacterium halobium
R. Mendelsohn
Editor’s Note
The purple membrane of the salt-loving photosynthetic bacterium Halobacterium halobium (and related organisms) contains the protein bacteriorhodopsin, which uses the energy of absorbed light to drive hydrogen ions (protons) through its central channel, creating a gradient in acidity across the membrane that can be tapped for chemical energy. This system has become archetypal in the study of biological energy conversion and proton transfer, as well as attracting technological interest for solar energy. Here Richard Mendelsohn of King’s College, London, uses spectroscopy to identify the fundamental process of light absorption by the light-sensitive chemical group in the core of the protein. The details of how photochemical changes in this group lead to the movement of protons are still being worked out. 中文
Use of the resonance Raman technique has shown that the colour of the purple membrane pigment of H. halobium arises from an unprotonated Schiff base whose electron density is perturbed by further (electrostatic) interaction with a protein. The chromophore probably consists of a charge transfer complex between retinyllysine and an appropriate side chain of the protein. 中文
RESONANCE Raman spectra have been reported for several molecules of biological interest, including haemoglobin 1,2 , cytochrome C 2,3 , rubredoxin 4 and several carotenes 5 and retinals 6,7 . The resonant enhancement of certain Raman-active vibrations occurs when molecules are excited by light of a wavelength lying within an electronic transition 8 , and the effect provides a structural probe at unusually low solution concentration. Of particular importance to biological systems is the feasibility of in situ examination. 中文
One potentially useful area of application for this technique is to photoreceptor pigments. The bathochromic shifts in visual pigments have not yet been satisfactorily explained. The absorption maxima of these pigments, in which there appears to be a Schiff base of 11- cis retinal with the ε-amino group of a lysine residue, vary from 430 to 562 nm (ref. 9). Solutions of the Schiff base itself, however, absorb near 360 or 440 nm, depending on whether the nitrogen atom is unprotonated or protonated, respectively. Thus another specific interaction occurs between protein and chromophore which perturbs the chromophore absorption band and gives rise to pigment colour 10 . Several theories proposed to explain visual pigment spectra have been reviewed by Abrahamson and Ostroy 11 . The two most important ones are those of: (1) Morton et al. 12,13 , which assumes that the primary bond is a protonated Schiff base in which the bathochromic shifts are provided by negatively charged groups appropriately positioned adjacent to the polyene chain; (2) the Dartnall formulation 9 , which assumes that the primary bond is an unprotonated Schiff base, with secondary shifts caused by an optimally placed pair of charges, producing massive dipoles in the polyene. Little experimental evidence is available with which to test either description. 中文
Because of the anticipated extensive photochemical changes associated with the shining of intense laser radiation on a sample containing rhodopsin, I decided to examine initially the photoreceptor-like pigment of Halobacterium halobium . The “purple membrane” fragment containing the pigment offered several advantages for a laser-Raman spectroscopic study. ( a ) The primary structure of the chromophore is retinyllysine, the evidence being much the same as that for rhodopsin 14 . ( b ) Unlike rhodopsin, the pigment does not bleach or undergo photochemical changes on even prolonged exposure to intense (>200 mW) laser light, but simply undergoes a reversible spectral shift from λ max =558 nm to λ max =570 nm on exposure to red or blue light respectively 14 . ( c ) The membrane is easily handled at room temperature in aqueous suspension. 中文
The purple membrane used in the study described here was the gift of Drs D. Oesterhelt and A. E. Blaurock. 中文
Cells of Halobacterium halobium were grown and the purple membrane fragments isolated as previously described 14 . Suspensions of membrane used for Raman spectroscopy had an optical density of 3.0 at λ max . 中文
Raman spectra of purple membrane fragments excited with 4880 Å and 5145 Å radiation are shown in Fig. 1. The most intense vibration in each spectrum occurs at 1,531 cm –1 and about fifteen other peaks have also been distinguished. The only significant difference in the two spectra is the relative intensity of the 1,568 cm –1 vibration compared with that at 1,531 cm –1 . The former appears about four times more intense when excited by 4880 Å radiation than when excited by 5145 Å excitation. This observation is explained below. 中文
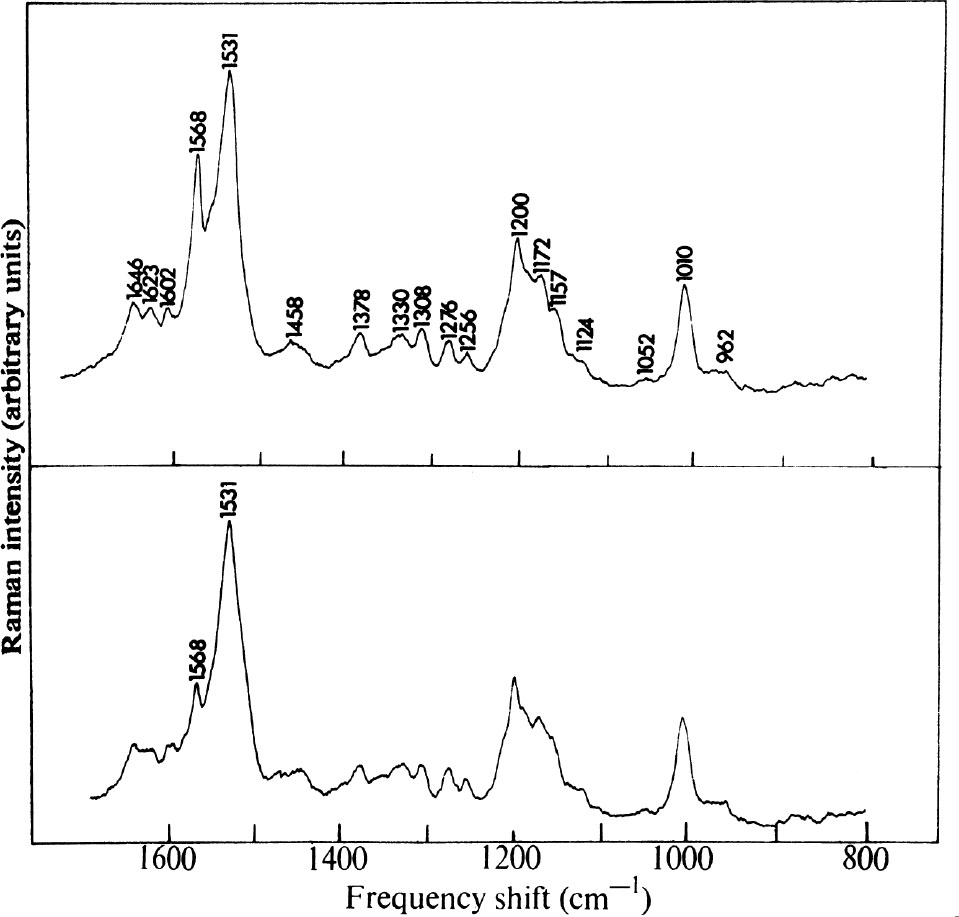
Fig. 1. Raman spectra of an aqueous suspension (5.5×10 –5 M in the purple protein, p H 7.0, unbuffered) of purple membrane fragments obtained with a “Spex”1401 Raman Spectrophotometer using: (Top) 100 mW of 4880 Å radiation from an Ar + laser. Resolution, 7 cm –1 ; time constant 2 s; scanning rate 25 cm –1 min –1 ; photon counting detection; 1 mm i.d. capillary cell, transverse excitation. (Bottom) 125 mW of 5145 Å radiation from an Ar + laser. Conditions as above. Polarization measurements indicated that all observed vibrations had depolarization ratios 0≤ρ≤0.3. Spectra of membrane fragments suspended in 4 N NaCl solution are identical with those shown, as are spectra obtained in 0.05 M phosphate buffer ( p H 7.0).
Several experiments showed that the observed spectra were resonance-enhanced. (
a
) The protein concentration as measured from the visible spectrum (ε
max
=54,000 l/mol cm)
14
was 5.5×10
–5
M or two orders of magnitude less than that required to obtain ordinary protein Raman spectra
15
. (
b
) On bleaching the pigment with 0.1 M cetyltrimethyl-ammonium bromide (
p
H 7.9), a procedure which leaves the Schiff base intact but destroys the purple colour
14
, no spectrum could be observed. (
c
) An excitation profile (variation of Raman intensity with excitation wavelength) experiment was carried out as follows. Samples of membrane were prepared containing 0.1 M Na
2
SO
4
in which the non-resonant enhanced symmetric stretching vibration of the
 ion at 983 cm
–1
was used as an internal standard. The ratios of the intensities of the peaks at 1,531 and 1,568 cm
–1
to the intensity of the standard were determined as a function of excitation wavelength using six lines available from the argon ion laser, all of which lie on the high frequency side of the pigment absorption band. The results are shown in Fig. 2. It is clear that there is substantial deviation from the 1/λ
4
law for intensity of scattered light, as the observed ratios would not vary with wavelength if this relationship were obeyed. The two vibrations studied appear to be enhanced by (vibronic) coupling to different components of the membrane absorption spectrum. The peak at 1,531 cm
–1
increases in relative intensity as the exciting line increases in wavelength toward the pigment λ
max
. It is therefore coupled to the main pigment absorption. The 1,568 cm
–1
band, however, is increased in relative intensity as the wavelength is decreased, and it is therefore not coupled to the visible component of the membrane spectrum but to an absorption located at shorter wavelength than the main band.
中文
ion at 983 cm
–1
was used as an internal standard. The ratios of the intensities of the peaks at 1,531 and 1,568 cm
–1
to the intensity of the standard were determined as a function of excitation wavelength using six lines available from the argon ion laser, all of which lie on the high frequency side of the pigment absorption band. The results are shown in Fig. 2. It is clear that there is substantial deviation from the 1/λ
4
law for intensity of scattered light, as the observed ratios would not vary with wavelength if this relationship were obeyed. The two vibrations studied appear to be enhanced by (vibronic) coupling to different components of the membrane absorption spectrum. The peak at 1,531 cm
–1
increases in relative intensity as the exciting line increases in wavelength toward the pigment λ
max
. It is therefore coupled to the main pigment absorption. The 1,568 cm
–1
band, however, is increased in relative intensity as the wavelength is decreased, and it is therefore not coupled to the visible component of the membrane spectrum but to an absorption located at shorter wavelength than the main band.
中文
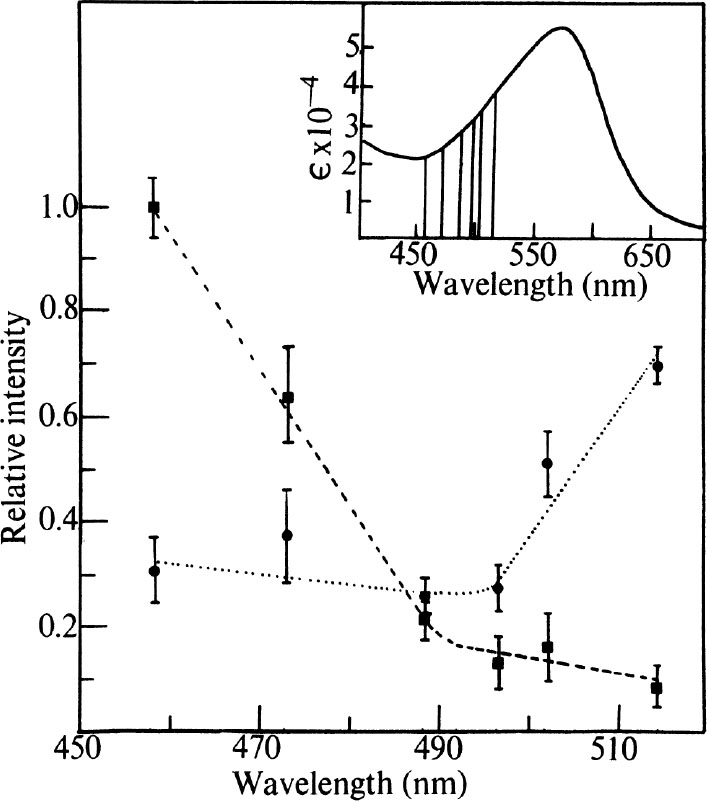
Fig. 2. Excitation profile results. ---, Ratio of the integrated intensities of 1,568 cm
–1
vibration compared with 983 cm
–1
vibration of
ion used as internal standard. …, Same ratio comparing the 1,531 cm
–1
vibration with the standard. ■ and ●, Experimental points, observed at the indicated laser wavelength. Error bars represent standard deviations based on four measurements. Insert, pigment absorption band of purple membrane. Vertical lines indicate positions of laser lines located at 457.9, 472.7, 488.0, 496.5, 501.7 and 514.5 nm. The visible absorption spectrum was recorded on a “Unicam” SP-800A spectrophotometer using cells of 2 mm path length.
All of the other vibrations (except that attributable to solvent O–H bending at 1,646 cm –1 ) behave in a fashion similar to the 1,531 cm –1 vibration and hence arise from coupling to the 560 nm band of the pigment. 中文
Spectral analysis is simplified by the fact that only chromophore vibrations are observed in the resonance Raman effect 1-3 . Protein vibrations are of insufficient intensity to be seen and therefore do not complicate the spectra. In this work the region 1,500-1700 cm –1 which contains C=C and C=N stretching vibrations will be considered. The region below 1,500 cm –1 , which contains C–C stretching and C–H bending modes, will be discussed in a future publication. 中文
Rimai and coworkers have made a detailed Raman spectroscopic study of various retinals 7 and their Schiff bases 6 . They found that those vibrational modes most strongly enhanced are contributed by C=C and C–C stretching in the conjugated chain, which occur near 1,570 and 1,200 cm –1 , respectively. In addition, they identified C=O and C=N stretching vibrations in the range 1,600-1,670 cm –1 . 中文
In Fig. 3 a and c , the 1,500-1,700 cm –1 region of the Raman spectra of unprotonated and protonated retinylhexylamine are shown. The C=N frequencies in this model Schiff base are expected to be similar to those of the pigment Schiff base and can be used to decide whether the nitrogen of the latter is protonated. In the unprotonated form (Fig. 3 a ), v (C=N) occurs as a weak band near 1,623 cm –1 while v (C=C) appears strongly at 1,579 cm –1 . In protonated retinylhexylamine (Fig. 3 c ) the C=N stretching frequency is broadened and shifted to 1,645 cm –1 , while v (C=C) is shifted to 1,559 cm –1 . 中文
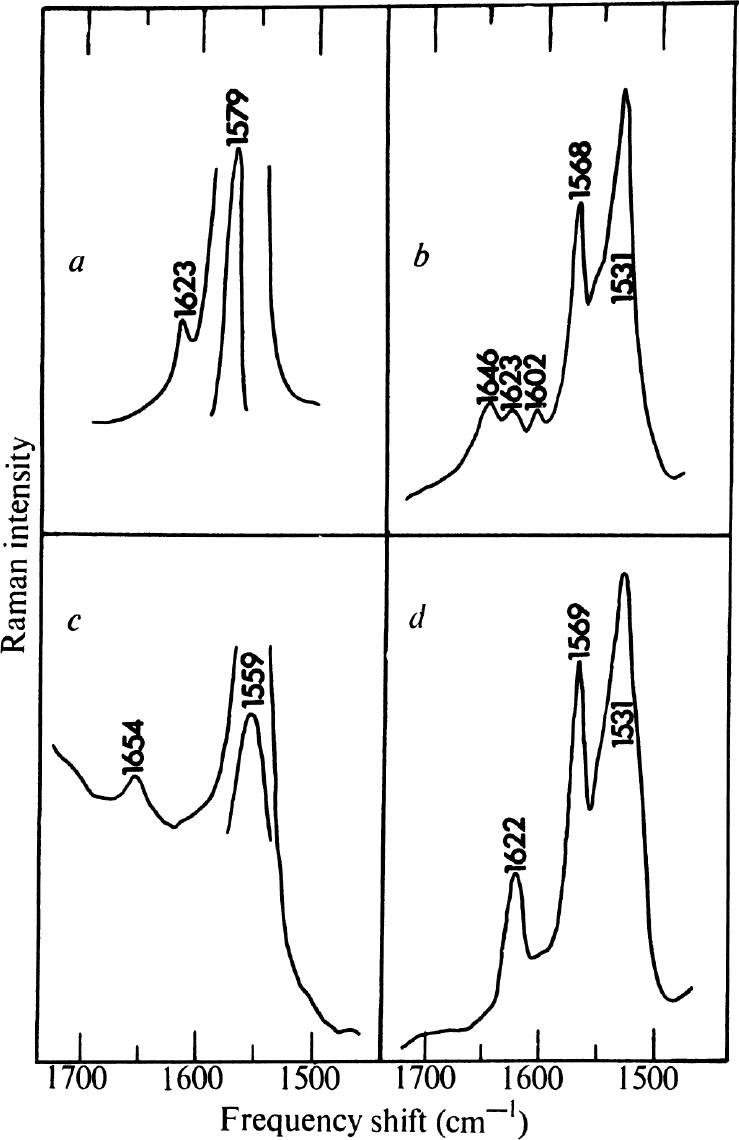
Fig. 3. 1,500-1,700 cm –1 region of the Raman spectra of a , unprotonated retinylhexylamine (10 –3 M in C 6 H 14 solution, λ max =360 nm); b , purple membrane fragments in H 2 O suspension (see Fig. 1 (top), caption); c , protonated retinylhexylamine (10 –4 M in acidified EtOH solution, λ max =445 nm); d , purple membrane fragments in D 2 O suspension (conditions as in Fig. 1 (top) except for solvent). All spectra recorded using 4880 Å radiation. The difference in concentration in a and c reflects the increased resonant enhancement as the retinylhexylamine absorption band is shifted into the visible region. There is little or no change in the Raman frequencies of this Schiff base as a function of solvent. The best spectra of unprotonated and protonated retinylhexylamine were obtained in the solvent indicated.
In Fig. 3 b , the 1,500-1,700 cm –1 range of the purple membrane spectrum is shown. This region is complicated by the presence of a weak solvent OH bending vibration at 1,646 cm –1 , although distinct peaks are seen at 1,531, 1,568, 1,602, and 1,623 cm –1 . The peak at 1,568 cm –1 is assigned to v (C=C) of the Schiff base. The excitation profile results described above indicate that this vibration arises from retinyllysine other than that in the pigment. Whether this free Schiff base is significant to the structure of the pigment is not clear. On suspension of the purple membrane in D 2 O, the 1,646 cm –1 band disappears as expected, while the vibration near 1,623 cm –1 becomes more prominent (Fig. 3 d ) than in the H 2 O preparation. This band, assigned to C=N stretch of the Schiff base, appears at the same frequency as in unprotonated retinylhexylamine and strongly suggests that the Schiff base in the pigment itself is unprotonated. 中文
The strongest peak in the purple membrane Raman spectrum at 1,531 cm –1 has no counterpart in the spectra of the model Schiff bases, all of which have intense C=C stretching vibrations above 1,550 cm –1 . The intensity of the 1,531 cm –1 band implies strong vibronic coupling to the pigment absorption and it is suggested that, by its magnitude and position, the vibration is still due to retinal C=C stretch. The frequency decrease indicates that the π electron density of the conjugated system has been perturbed and electrons removed from the C=C bonds. Such a process would reduce the C=C stretching force constants and lower v (C=C). 中文
The above observations indicate that pigment colour arises from an unprotonated Schiff base whose π electron density is perturbed by further (electrostatic) interaction with the protein. Additional evidence for this description was obtained when it was noticed that the purple membrane λ max is highly solvent dependent (C. W. F. McClare, personal communication). Addition of a small amount of chloroform reversibly shifts λ max of the pigment to 500 nm and the main Raman frequency to 1,520 cm –1 . The chloroform seems to penetrate to the chromophore and thereby perturbs its electronic arrangement. 中文
The exact geometry of the purple membrane pigment must await a three-dimensional structure determination; however, one model which this study points to is that of a charge transfer complex 16 between retinyllysine and an appropriate side chain of the protein. Such interactions can account for the large shift in λ max (from 360 nm to ~560 nm) of the chromophore as well as the perturbation of chromophore vibration frequencies upon complex formation. In addition λ max in such complexes are quite solvent dependent 16 , as observed in the present case. That such a mechanism is feasible has been shown by Ishigami et al. 17 , who observed charge transfer between tryptophan and 9- cis retinal in acidified methanol solution (λ max of complex=520 nm). Furthermore, I have observed charge transfer between indole and trans retinal (λ max =625 nm) in the same solvent. It is therefore quite conceivable that an appropriately positioned tryptophan residue on the protein interacts with the π electrons of the Schiff base and produces the purple pigment colour. 中文
A Raman spectroscopic study of rhodopsin and the intermediates present in its low temperature bleaching sequence would yield valuable information as to the nature of the Schiff base-protein interactions that determine pigment colour. The work described here illustrates the feasibility of such studies and the power of the resonance Raman technique in providing a structural probe for the photoreceptor pigments. 中文
I thank Drs A. E. Blaurock, W. R. Lieb, and C. W. F. McClare for detailed discussions. This work was supported by the National Research Council of Canada. 中文
( 243 , 22-24; 1973)
R. Mendelsohn
Biophysics Department, King’s College, 26-29 Drury Lane, London WC2B 5RL
Received February 2, 1973.
References: