
下载掌阅APP,畅读海量书库
立即打开


 DNA Replication Sites within Nuclei of Mammalian Cells
J. A. Huberman et al .
Editor’s Note
Nearly 20 years after the structure of DNA was published, molecular biologists were still struggling to understand how DNA, the genetic material, is replicated in living cells of higher organisms (eukaryotes). The interest of this article is that it shows how rudimentary were scientists’ ideas of that process. Huberman et al . studied HeLa cells (a familiar strain of human cells derived from a cancer) during the process of mitosis (cell division). “S” phase is that during which a cell about to divide accumulates the material eventually needed to make two cells. They conclude that DNA is first synthesized near the nuclear membrane but that it later migrates to the whole nucleus. 中文

DNA replication can occur throughout the nucleus and is not restricted to the inner surface of the nuclear membrane. 中文

THE involvement of a membrane site in DNA replication was first suggested by Jacob, Brenner and Cuzin 1 in their “replicon” model for replication of bacterial DNA, but the evidence accumulated since then is inconclusive. In prokaryotic cells, co-sedimentation of DNA replication points and cell membranes has been demonstrated 1-4 , and the origin of replication and the membrane found to be associated 5 . A lipid-free replicating DNA-protein complex from E. coli has been isolated 6 and it has been reported that only the origin, but not the growing points, of the E. coli chromosome is attached to membrane 7 . 中文
In cell fractionation experiments with mammalian cells it was also found that replication points, detected by pulse-labelling with 3 H-thymidine (TdR), are associated with the nuclear membrane (or some other large, light, hydrophobic cell structure) 8-11,13 . Association between replication points and the nuclear membrane has also been detected by electron microscope autoradiography of thin sections through pulse-labelled, unsynchronized HeLa cells. The label associated with the membrane apparently moved into the nuclear interior after a 1 h chase 13 . 中文
On the other hand, most electron microscope autoradiographic experiments suggest that replication can take place throughout the nucleus. For instance, Comings and Kakefuda 14 generally found grains located throughout the nucleus when unsynchronized human amnion cells were pulse-labelled for 5 min or more with 3 H-TdR and then sectioned and autoradiographed. When, however, cells that were supposedly synchronized at the beginning of S phase were pulse-labelled for 5 or 10 min, grains were found predominantly over the nuclear membrane. Comings and Kakefuda concluded that initiation of replication takes place on the nuclear membrane, whereas the replication occurs anywhere within the nucleus. 中文
Somewhat different results were obtained by Blondel 15 , using KB cells and pulse times of 2 min; Williams and Ockey 16 , using Chinese hamster cells and pulse times of 10 min or longer; and Erlandson and de Harven 17 , using HeLa cells and pulse times of 15 min. All three groups concluded, in agreement with Comings and Kakefuda 14 , that during a large part of the S phase grains are produced over the entire nucleus, but they differed from them in finding a peripheral pattern of grains more frequently at the end of the S phase than at the beginning. A cell fractionation experiment by Kay et al . 18 also demonstrated association of late-replicating but not early-replicating DNA with the nuclear membrane. 中文
Regardless of the time in S phase at which replication occurs close to the nuclear membrane, one important implication of most of these electron microscope autoradiography experiments is that, in some parts of S phase, at least, replication occurs throughout the nucleus. How can this implication be reconciled with the experiments indicating that all replicating DNA is associated with the nuclear membrane? It is possible that a considerable amount of DNA is synthesized during a pulse as short as 2 min. Huberman and Riggs 19 have shown that the rate of DNA replication in Chinese hamster cells can be as much as 2.5 µm min –1 , although most replication seems to occur at rates between 0.5 and 1.2 μm min –1 . Thus as much as 5 µm of DNA could be synthesized during a 2 min pulse. If this DNA were synthesized at the nuclear membrane and then stretched out, it could reach the centre of a nucleus of diameter 5-8 µm and give rise to a false impression of the location of sites of DNA synthesis. 中文
This effect could be ruled out by shorter pulses. We calculated that a pulse of 0.5 min would provide sufficient grains, after an exposure of several months, and the resolution (less than 1.25 μm of DNA synthesized) necessary to distinguish between replication solely at the nuclear membrane and replication elsewhere in the nucleus. 中文
In most experiments, we used Chinese hamster (CHO) cells, which can be easily synchronized. The cells were pulse-labelled for 0.5 min with 3 H-TdR, then washed, fixed, embedded, sectioned and stained. The sections were placed on grids and autoradiographed by standard techniques 20 . After exposure times of several months, the emulsions were developed and the grids were examined by electron microscopy. 中文
Cells from an unsynchronized culture, shown in Fig. 1, illustrate the variety of distribution of grains over the nucleus. The cells in Fig. 1A and B are labelled throughout the nucleus (general pattern), whereas the cells in Fig. 1C and D are labelled predominantly around the nuclear membrane (peripheral pattern). The grains in Fig. 1E are mostly clustered over regions of condensed chromatin, frequently near the membrane. Fig. 1F shows a cell with grains throughout the nucleus but with some concentration around the nuclear membrane. 中文
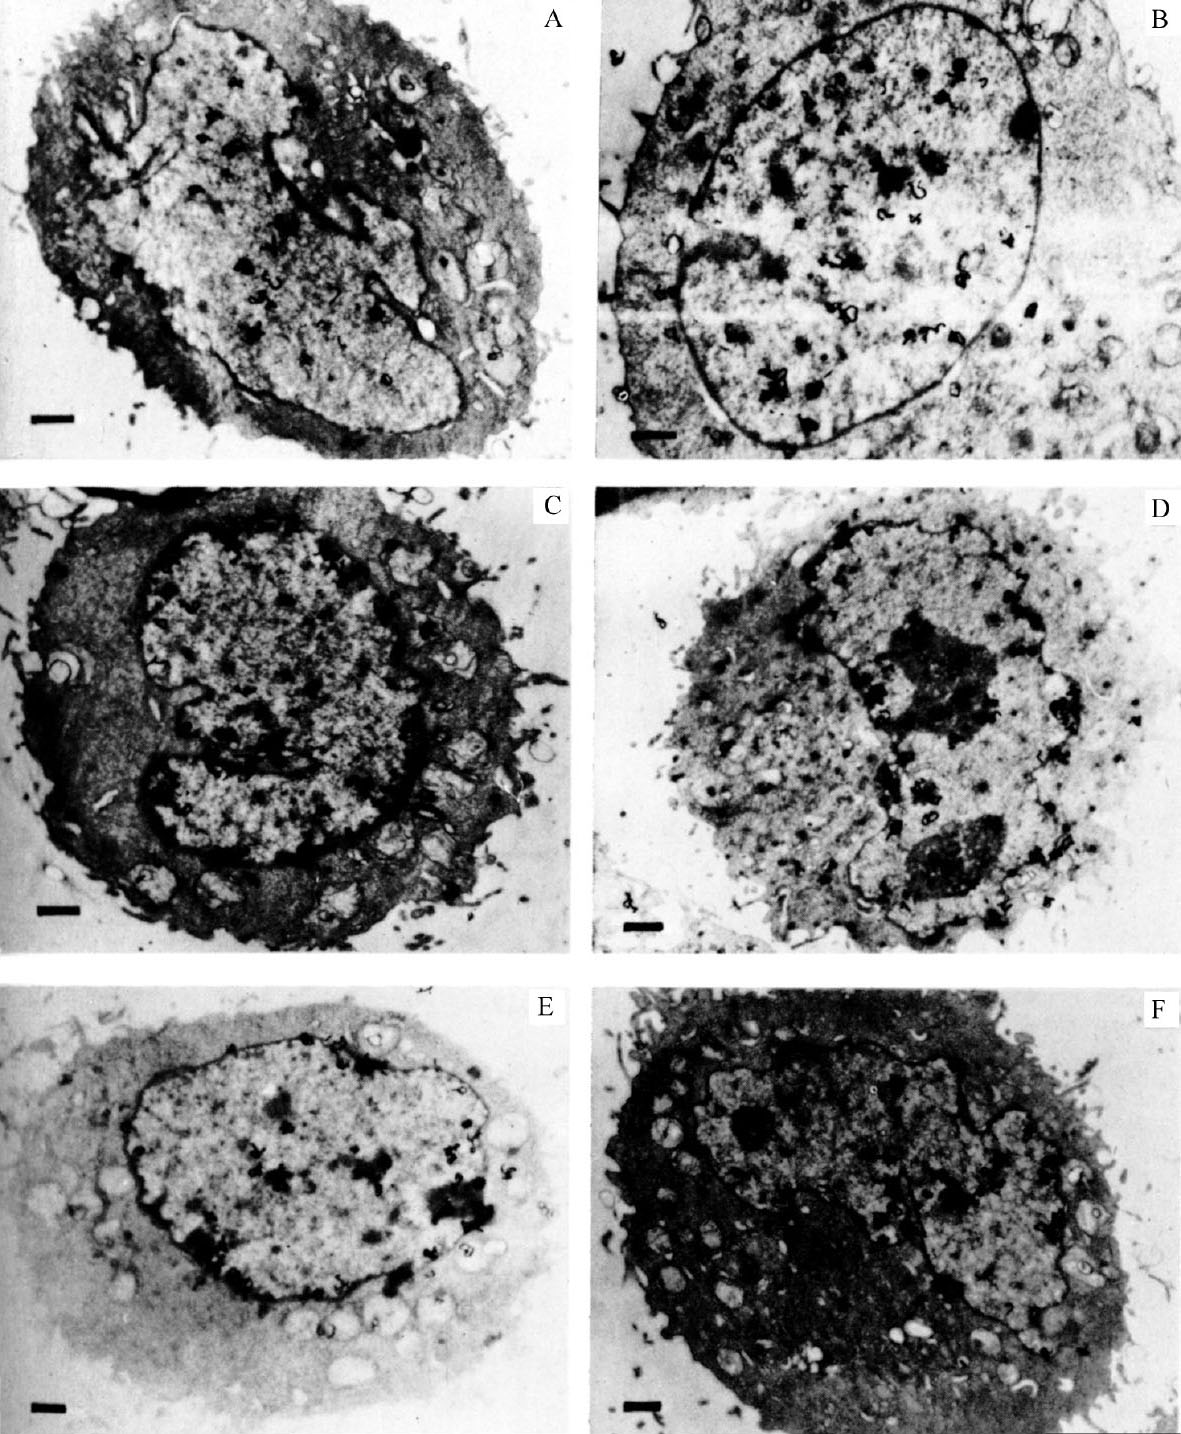
Fig. 1. Autoradiography of unsynchronized CHO cells exposed to 3 H-TdR for 0.5 min. A and B, grains distributed over entire nucleus. C and D, grains distributed around nuclear membrane. E, clustered grain distribution. F, mixed grain distribution. CHO cells were grown on Petri plates in Joklik-modified MEM (Grand Island Biological Company) supplemented with 7% foetal calf serum and non-essential amino-acids. Pulse-labelling was performed by first adding 5-fluorouridine deoxyriboside (FUDR; Hoffmann-LaRoche) to a final concentration of 1.6 μg ml. –1 to inhibit further biosynthesis of dTTP. After 1 min, 3 H-TdR (51 Ci mmol –1 ; New England Nuclear) was added to 17 μCi ml. –1 . After 30 s the plates were removed from 37℃, and the medium rapidly sucked off. The plates were then washed with ice-cold isotonic saline containing FUDR at 0.1 μg ml. –1 (two changes). Cells were removed from the plates by trypsinization at room temperature in isotonic saline still containing FUDR. The cells were pelleted, then fixed with glutaraldehyde and OsO 4 , dehydrated, embedded in epoxy resin 29 and cut into gold-purple sections. The sections were mounted on grids and autoradiographed by the technique of Caro and Van Tubergen 20 except that the acetic acid stop bath was replaced with distilled water. Exposure time was 3.5 months. The bar in each figure represents 1 μm.
Many grains are found in some cells more than 1.25 μm from the nuclear membrane (central grains), suggesting that replication is taking place at sites away from the membrane. To be certain of that conclusion, however, other possible explanations must be ruled out. The central grains cannot be due to background because few or no grains are found over the cytoplasm. They must be due to incorporation into DNA since no grains are found over G1 or G2 cells (see below), and the grains of isolated nuclei can be removed by DNAase. The central grains could also originate from DNA replication occurring on invaginations of the nuclear membrane either just above or just below the section plane. While this might explain some central grains, it certainly cannot explain most of them. Because the cells are sectioned with random orientations, we can get some idea of the frequency of invaginations which might bring nuclear membrane within 1.25 μm of the section plane from the frequency of invaginations in the nuclear periphery. Although some peripheral invaginations are evident in Fig. 1, they are not so frequent that most of the central area could be 1.25 μm or less from an invagination. 中文
In some preliminary experiments we used HeLa cells, which have much more regular nuclei: central grains were also found over their nuclei (Fig. 2). Even serial sections up to 0.5 μm apart through a single cell all showed central grains. The change in pattern from general labelling in early S to peripheral labelling in late S suggests that general labelling is not an artefact of sectioning. Finally, the central grains cannot be accounted for by internal membranes within the nucleus. Such membranes have never been seen by other electron microscopists; apart from invaginations of the peripheral membrane we could see none in our sections. 中文
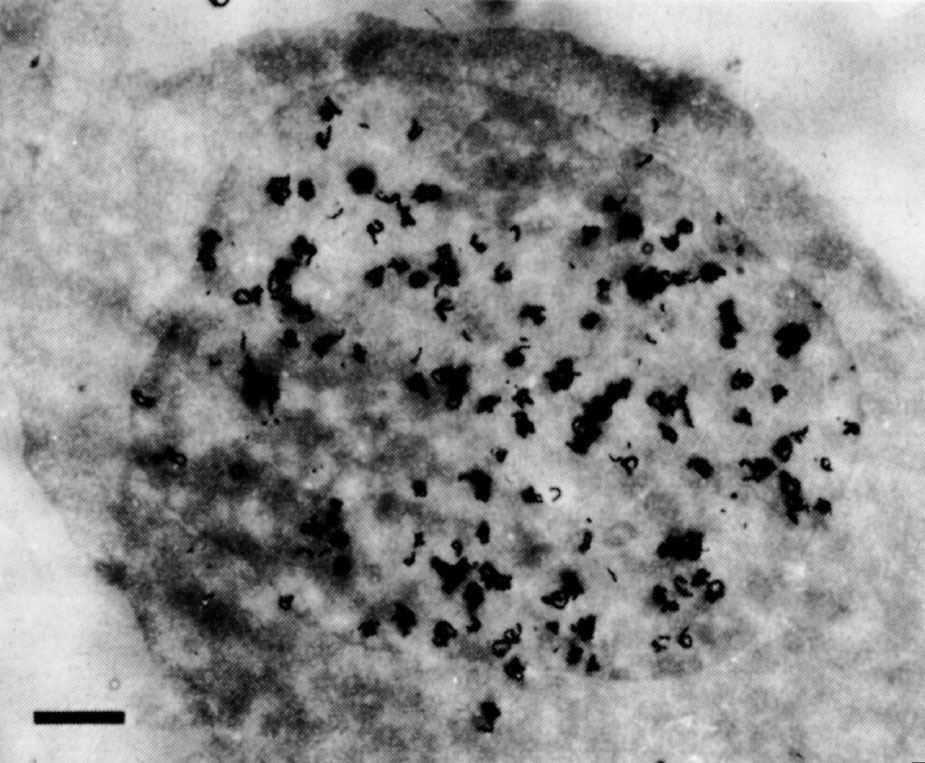
Fig. 2. Autoradiography of a HeLa cell exposed to 3 H-TdR for 1.5 min. The cells were grown in suspension culture in Joklik-modified MEM (Grand Island Biological Company) supplemented with 5% horse serum. Pulse-labelling was done by adding 3 H-TdR (20 Ci mmol –1 , New England Nuclear) to a concentration of 20 μCi ml. –1 . Exactly 1.5 min after addition of 3 H-TdR, the pulse was terminated by addition of an equal volume of ice-cold isotonic saline containing 1% glutaraldehyde. Subsequent processing was as in Fig. 1. Exposure time was 9.5 months. The bar represents 1 μm.
To express quantitatively the proportion of cells showing peripheral labelling, we have modified the method of Williams and Ockey 16 . We defined central grains as those further than 1.25 μm from the nearest nuclear membrane, and peripheral grains to be those closer than 1.25 μm to the nuclear membrane. The “central activity” of a cell section was calculated as the ratio of the fraction of central grains: the fraction of nuclear area which was central. Nucleolar areas and grains were excluded because the nucleolus has less DNA than the rest of the nucleus. A histogram showing the frequency of various central activities for an unsynchronized cell population is shown in Fig. 3 (a central activity of 1.0 implies an equal concentration of grains over central and peripheral areas). 中文
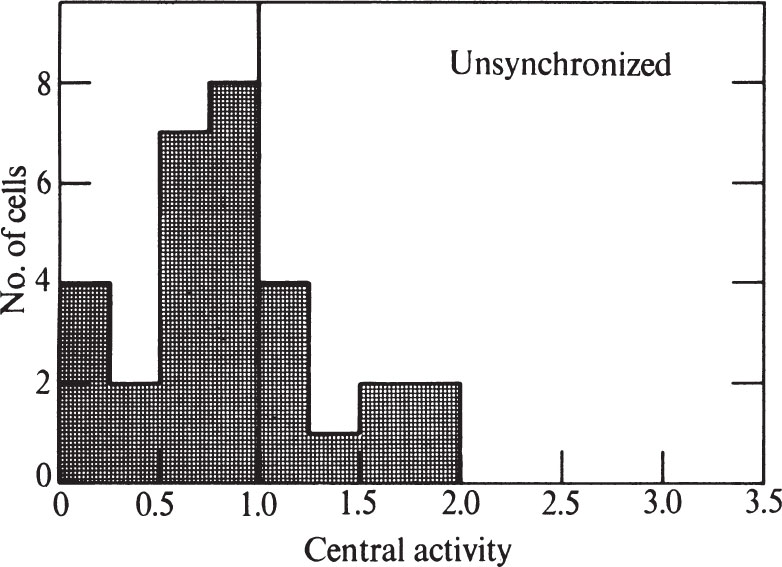
Fig. 3. Distribution of grains over unsynchronized CHO cells exposed to 3 H-TdR for 0.5 min. Prints at about×15,000 magnification were made of autoradiograms of individual randomly chosen cells similar to and including those in Fig. 1. A line was drawn within each nucleus which was at all points 1.25 μm away from the nearest nuclear membrane. This line divided the nucleus into a central area and a peripheral area. Grains were counted over each area, and the size of each area was measured. In these determinations, grains lying over the nucleolus, and nucleolar areas, were ignored because the nucleolus has so much less DNA than the rest of the nucleus. Grains lying outside the nucleus were also ignored. “Central activity” was calculated as the ratio of the fraction of grains which were central to the fraction of area which was central. Thirty nuclei were measured for the histogram.
Only 13% of the cells in Fig. 3 have central activities of less than 0.25, showing that DNA synthesis can go on at sites away from the nuclear membrane. The nuclear membrane is therefore not essential for DNA replication in Chinese hamster cells. But the fact that many cells do show a predominantly peripheral pattern remains to be explained. 中文
Since previous autoradiographic studies 14-17 had suggested that peripheral labelling occurs only at certain times during the S phase, we decided to try short pulse-labelling of cells synchronized to various times during the cell cycle. We chose “Colcemid” reversal 21 to synchronize the cells. Growing cells were treated with “Colcemid” for a few hours and the cells blocked in mitosis collected by selective trypsinization. These cells (90-100% mitotic) were allowed to continue growing in the absence of “Colcemid”. Within 2 h, 98.5% of the cells completed division, and by 18 h after release from mitosis, more than 70% of the cells had divided again. We preferred this synchronization method to methods involving starvation of nucleotides 21 , because cells recover excellently and normal DNA replication is not affected. 中文
Table 1 and Fig. 4 show the distribution of grains within the nucleus as a function of time after release from mitosis. Peripheral labelling cannot be detected in the early stages of S but becomes predominant in later S. 中文
Table 1. Extent of DNA Synthesis in Synchronized CHO Cells
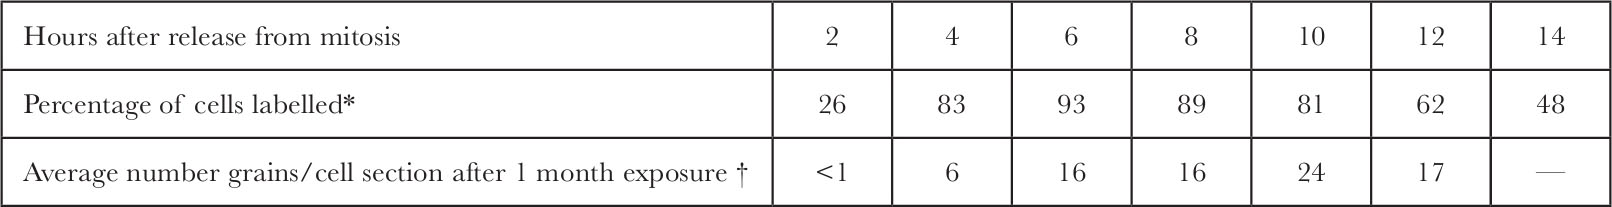
* Cells were synchronized as in Fig. 4. At 2 h intervals after release from mitosis, 3 H-TdR (20 Ci mmol –1 ; New England Nuclear) was added to each plate (17 μCi ml. –1 final concentration). After 10 min the cells were washed twice with cold isotonic saline, collected by trypsinization at room temperature, allowed to swell in hypotonic medium (2 mM MgCl 2 , 1 mM EDTA, 10 mM KPO 4 , p H 7.7) for 10 min, pelleted, fixed with methanol-acetic acid (3∶1), spread onto subbed glass slides and allowed to dry. The slides were coated with autoradiographic stripping film (“Kodak AR-10”) and exposed for 7 days. After development, the slides were stained with Giemsa stain, then mounted under “Permount”. At least 312 cells were scanned to determine the percent of cells labelled at each time point.
† The total number of grains over each nuclear section was determined for the autoradiographs used in Fig. 4. These figures were divided by the exposure time in months. Extra data for 2 h and 8 h after release from mitosis are included here.
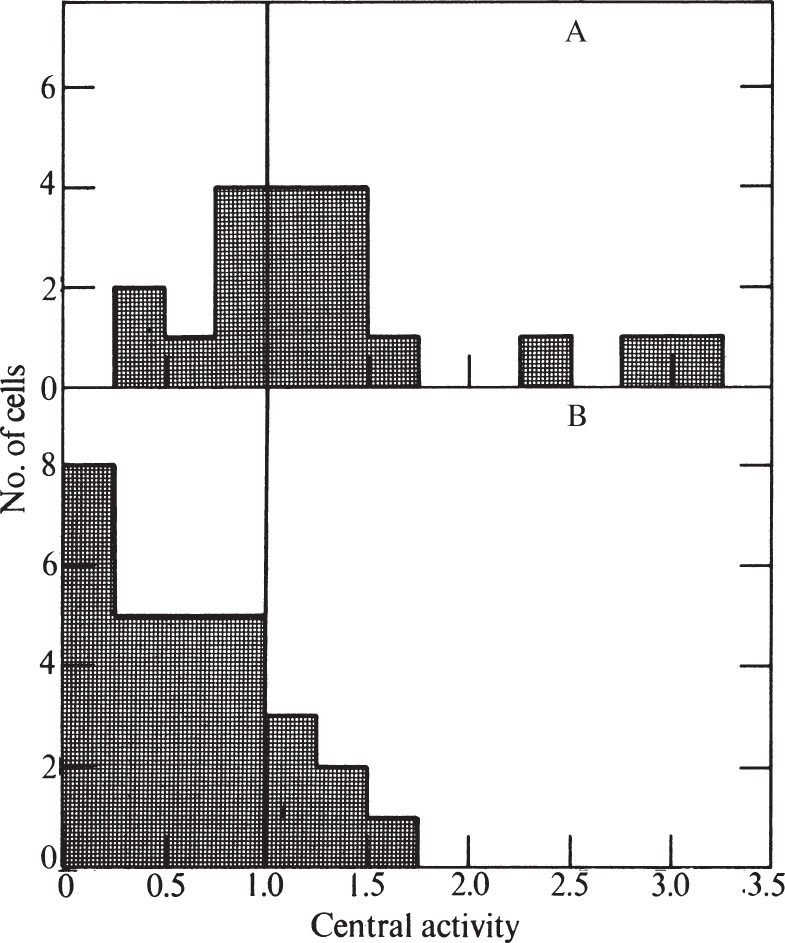
Fig. 4. Distributions of grains over synchronized CHO cells exposed to 3 H-TdR for 0.5 min. A, Early S phase (4-6 h after release from mitosis). B, Late S phase (10-12 h after release from mitosis). CHO cells were synchronized by the “Colcemid” reversal method of Stubblefield. Pulse-labelling (performed at 2 h intervals after release from mitosis), preparation for electron microscopy, and autoradiography were performed as in Fig. 1. Exposure time was 2-4 months. Histograms were prepared as in Fig. 3. For A, eight nuclei pulse-labelled at 4 h and eleven nuclei labelled at 6 h after mitotic release were used. For B, thirteen nuclei labelled at 10 h and sixteen nuclei labelled at 12 h were used.
If DNA is synthesized at the nuclear membrane (or other localized sites within the nucleus), then the DNA should move toward the membrane for replication and away from the membrane afterwards. The pattern of grains after a long pulse or pulse-chase should then be different from that after a simple short pulse. If, on the other hand, DNA replication can take place anywhere in the nucleus, then DNA movement is unnecessary and the grain pattern after pulse-chase labelling could be identical to that after simple pulse-labelling. 中文
To test these possibilities, we first pulse-labelled synchronized cells for 0.5 min during the first half of the S phase (6 h after release from mitosis), and then chased with non-radioactive thymidine to late S phase (12 h after release from mitosis). Although the cells were examined in late S phase, they showed no higher proportion of peripheral labelling than expected for cells 6 h after release from mitosis (compare Figs. 4 and 5). In addition, unsynchronized cells pulse-labelled for 0.5 min show the same proportion of peripheral and general labelling as unsynchronized cells pulse-labelled for 10 min, or pulse-labelled for 0.5 min and then chased for 6.75 h(Fig. 5). In both of the chase experiments, the cells were more labelled after the chase than before, probably because incorporation of 3 H-TdR continues from the cells’ internal pools. 中文
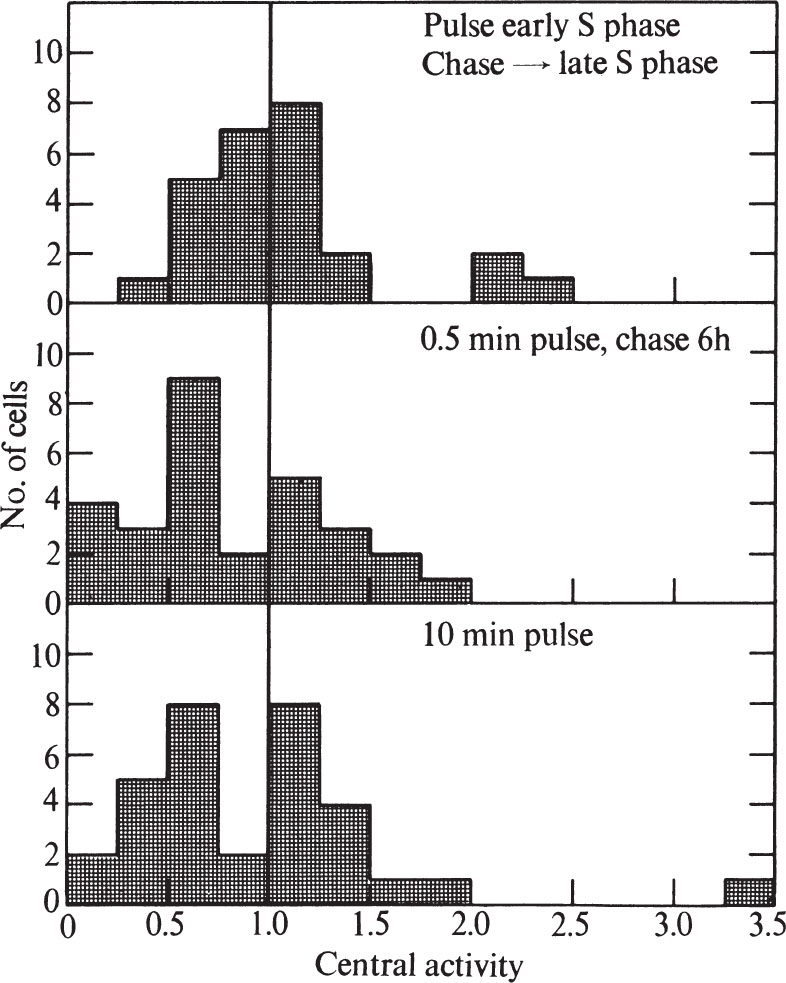
Fig. 5. Distribution of grains over CHO cells after pulse-chase or long pulse-labelling with 3 H-TdR. A, Synchronized cells (see Fig. 4) were pulse-labelled 6 h after release from mitosis as in Fig. 1. Then 30 s after addition of label, the medium was sucked off and the plates were washed, then replaced with medium containing 2.5 μg ml. –1 of TdR. After 6 h the cells were collected by trypsinization and prepared for electron microscope autoradiography as in Fig. 1. Exposure time was 1.5-4 months. B, Unsynchronized cells were pulse-labelled as in Fig. 1 and chased for 6.75 h as in A. Exposure time was 3.25 months. C, Unsynchronized cells were pulse-labelled as in Fig. 1 except that the 3 H-TdR was left in contact with the cells for 10 min instead of 30 s. Exposure time was 1.5-6 months. In all cases, histograms were prepared as in Fig. 3. For A, twenty-four cells were used, whereas for B, twenty-nine cells were used, and for C, thirty-two cells were used.
Thus DNA has a stable location in the nucleus. Because some of the unsynchronized cells must have divided during the chase, our results suggest that DNA bound closely to the membrane in one generation is also bound to the membrane in the succeeding generation. 中文
Because we cannot detect any difference in labelling pattern between a 0.5 min pulse and a 10 min pulse, our results can be compared directly with those of previous investigators 15-17 who have used longer pulse times. Our results agree with most of the earlier results; a general-label pattern is obtained in early S phase and a peripheral one in late S phase 15-17 , and chase experiments show that the nuclear position of DNA, once replicated, is stable 15,16 . 中文
The increased labelling during chase experiments, together with an apparently lower rate of synthesis in early S phase (Table 1), suggests an explanation for the autoradiographic results of O’Brien et al . 13 . In their pulse experiment, generally-labelled cells in early S phase may have been overlooked because they have few grains per nucleus (and a more disperse distribution at that); the increased labelling provided by the chase would have made the generally labelled cells sufficiently obvious to count. 中文
Our results also partially disagree with those of Comings and Kakefuda 14 . They reported that cells synchronized to the beginning of S phase showed solely peripheral labelling. Williams and Ockey 16,22 suggested that Comings and Kakefuda’s results might be due to cell damage during the lengthy nucleotide starvation (24 h in the presence of excess thymidine and then 14 h in the presence of amethopterin) used to synchronize their cells. Indeed, the cytoplasms of the synchronized cells in Comings and Kakefuda’s experiments contain many large vacuoles (indicating serious cell damage), whereas their unsynchronized cells have normal cytoplasm. Why cell damage should result in a peripheral labelling pattern is not clear. The unexpected pattern may be related to the finding 12 that polyoma virus infection causes mouse satellite DNA, which is normally late replicating 23-25 , to replicate before bulk DNA. 中文
Because Comings and Kakefuda’s 14 results must be discounted owing to cell damage, it seems that DNA synthesis can occur throughout the nucleus, and the nuclear membrane is not involved in initiation of replication. We have found, however, that in very early S phase (2 and 4 h after release from mitosis), the rate of replication per cell (measured as the average number of grains per nuclear section over labelled nuclei after a fixed exposure time) is much less than in later S phase (Table 1). This suggests that at the true beginning of S phase, the rate might be so low that we cannot detect labelling, let alone determine whether the pattern is peripheral or general. 中文
Heterochromatin has been shown to be replicated later than euchromatin and is condensed during interphase 26,27 . Our sections and those of others 14-17 , show a preponderance of condensed chromatin attached to the inner nuclear membrane. Thus our results are consistent with the notion 16 that euchromatin is replicated early in S phase and is distributed throughout the nucleus, whereas heterochromatin is replicated in late S phase and is condensed along the inner nuclear membrane and in other discrete areas. 中文
Whereas many of the cell fractionation experiments on the intranuclear location of DNA synthesis 8-11,13 have been interpreted in favour of attachment of replication sites to the nuclear membrane, this is not the only possible interpretation. Equally valid is the possibility that, after cell lysis, special structural properties of the growing points (extensive single strandedness, for instance) might result in their binding more protein, membrane, or other material than bulk DNA. Alternatively, the growing points may actually be attached inside the cell to some material that causes their separation from bulk DNA during lysate fractionation. 中文
As experiments with mammalian 8-11,13 and bacterial 2,3,5 cells used similar techniques and gave the same results, it is possible that the growing point in bacteria may also not be attached to the membrane. 中文
We thank Elaine and Robert Lenk for advice and assistance. This research was supported by grants from the National Science Foundation and the US National Institutes of Health. The electron microscopy was carried out in the Electron Microscope Facility of the Biology Department at MIT. 中文
Note added in proof . Fakan et al . 28 have recently obtained results similar to ours in both autoradiographic and cell fractionation experiments with mouse cells. 中文
( 241 , 32-36; 1973)
Joel A. Huberman, Alice Tsai and Robert A. Deich
Departments of Biology, Massachusetts Institute of Technology, Cambridge, Massachusetts 02139
Received May 4; revised December 15, 1972.
References: