
下载掌阅APP,畅读海量书库
立即打开


 Tectono-eustatic Changes in Sea Level and Seafloor Spreading
N. C. Flemming and D. G. Roberts
Editor’s Note
Today there is general concern that the accumulation of carbon dioxide in the atmosphere will lead to a melting of ice in the Arctic and Antarctic and so increase sea level. This paper by two scientists from the National Institute of Oceanography in Britain raised the question whether the process of continental drift could substantially change sea level. The principle underlying this research is that the Earth’s surface tends to be in “isostatic” equilibrium, meaning that the pressure exerted on the fluid mantle at great depths tends everywhere to be the same—in other words, continents exist only because they are less dense than the rocks that make up the sea bed in the great oceans. 中文

This article describes a model for estimating eustatic changes and evidence for a correlation with seafloor spreading. 中文

EUSTATIC changes in sea level are caused by a change in the form of the Earth’s crust or in the total volume of ocean water 1 . The best examples of the latter are the short duration (~10 5 yr) reversible changes caused by glacial advance and retreat during the Quaternary although there may also have been an increase in water volume by degassing from the mantle during the Mesozoic and Cainozoic 2,3 . Changes in sea level arising from changes in the form of the ocean basins are revealed in the geological record on continents as longer period (~10 7 yr) transgressions and regressions that mark global changes in sea level 4,5 , although the magnitude of the change may vary locally. Five principal factors 1,3,6 control sea level; of these, sediment deposition and trench formation may be neglected because the volumes are small or balanced by subduction. The most significant factors are (i) subsidence of the ocean crust, (ii) uplift of mid-ocean ridges and (iii) an increase or decrease in the length of the mid-ocean ridge system. These factors are, of course, controlled by sea-floor spreading and their relation to eustatic changes has been subject to speculation 5-13 . 中文
Here we present a model designed to estimate the magnitude of the eustatic change in sea level that would result from net alterations in the distribution of matter forming the continents and ocean floor, irrespective of the mechanisms involved. We assume a constant volume of water in the oceans and that there is no significant change in the average radius, shape or rotation of the Earth. On a smooth almost spherical Earth covered with the present volume of water, the ocean floor would be about 2,440 m below sea level, which would itself be about 240 m above present sea level 14,15 . 中文
Interaction between tectonics and sea level begins only when part of the lithosphere is raised above sea level; then any net vertical movement between the ocean floor and dry area will obviously produce a change in sea level. In particular, any increase in volume of solid crust above the water line must also be accompanied by an absolute lowering of sea level. In the context of plate tectonics, it is most meaningful to retain the distinction between continents and oceans in calculating departures from present continental areas and ocean depths. The global hypsographic curve 16,17 provides a convenient means of analysis (Fig. l a ) because constancy of water volume and rock density require that the total area representing crust and water volume must remain constant. To study a systematic series of deviations from the present curve, we varied the continent area ( x ) and maximum ocean depth ( y ) independently in 5% increments on either side of the present values, thereby defining forty-eight additional hypsographic curves. The base line for definition of the hypothetical continental areas was taken as the present area of continents at the altitude of present sea level, thus retaining the geophysical concept of a continent which may or may not be covered by water. Further, the profile of the continents was assumed to remain similar to the present profile and the oceanic part was altered by an amount proportional to its depth at all points, thereby preserving important features such as continental margins, mid-ocean ridges and satisfying fault distributions observed by Van Andel and Heath 18 ; horizontal dimensions were altered in the proportion new oceanic area/old oceanic area. 中文
From comparison with a new hypsographic curve (Fig. 1) we estimated the change in solid volume of the Earth beneath the ocean. This change was added to or subtracted from the volume of the continents above present sea level, and the new profile of the continents calculated using rules of proportionality similar to those used for the oceanic profiles. 中文
Two further boundary conditions are necessary and define the range of variability possible without causing total submergence or extreme altitude. Total submergence of the continents occurs if the postulated increase in Earth volume below the oceans is greater than the total volume of continents above present sea level. Large decreases in solid volume below the ocean, or large decreases in continental area, require excessive increases in continental altitude. Peak continental altitudes greater than twice the present value have been disregarded on isostatic grounds and because uplift is unlikely to exceed erosion by a sufficient amount. 中文
Typical hypsographic curves for two extreme conditions are shown in Fig. 1. For each of the generated curves, the ocean area was drawn in with constant ocean volume and the sea level derived to an accuracy limited by scale to ± 50 m. The resulting changes in sea level varied from the maximum rise of 240 m to a maximum fall of 800 to 1,000 m. Errors of about ± 20% were caused by difficulties in constructing the curves and measuring areas. 中文
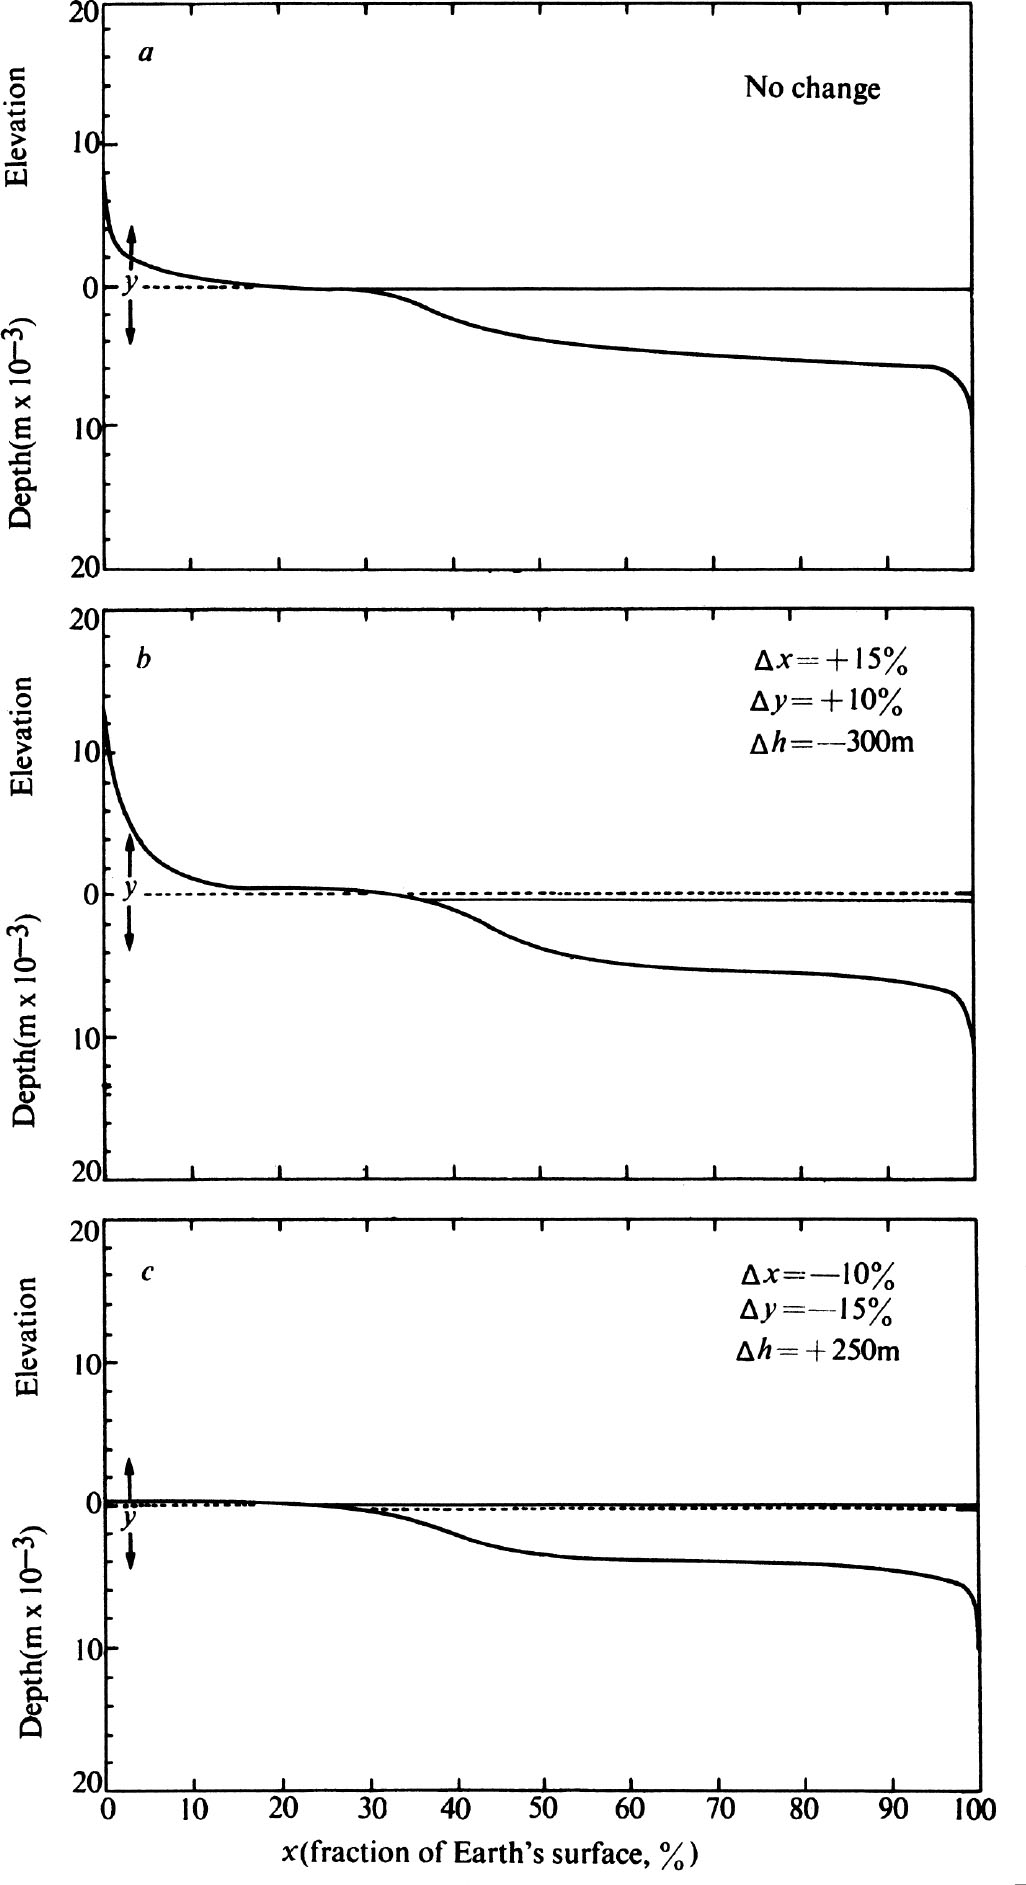
Fig. 1. a , The present hypsographic curve for the Earth 16,17 . b , Hypothetical hypsographic curve after increasing continental area at present sea level by 15% and increasing ocean depth by 10%. Note increased height of continents, and decrease of sea level by 300 m. c , Hypsographic curve resulting from decreasing continental area at present sea level by 10% and decreasing ocean depth by 15%. Although continents are not reduced below present sea level, the eustatic rise in sea level results in total inundation.
The model shows that small departures from the present proportion of continental area and ocean depth produce enormous changes in degree of flooding of continental margins (Fig. 2). For example, an extension of continental area results in a lowering of the mean height of continents, and an increase of land near present sea level with a necessary eustatic rise in sea level causing extensive trangression and shallow seas. An increase in continental area of 10 % accompanied by a 6 % decrease in mean ocean depth would submerge all continents. 中文
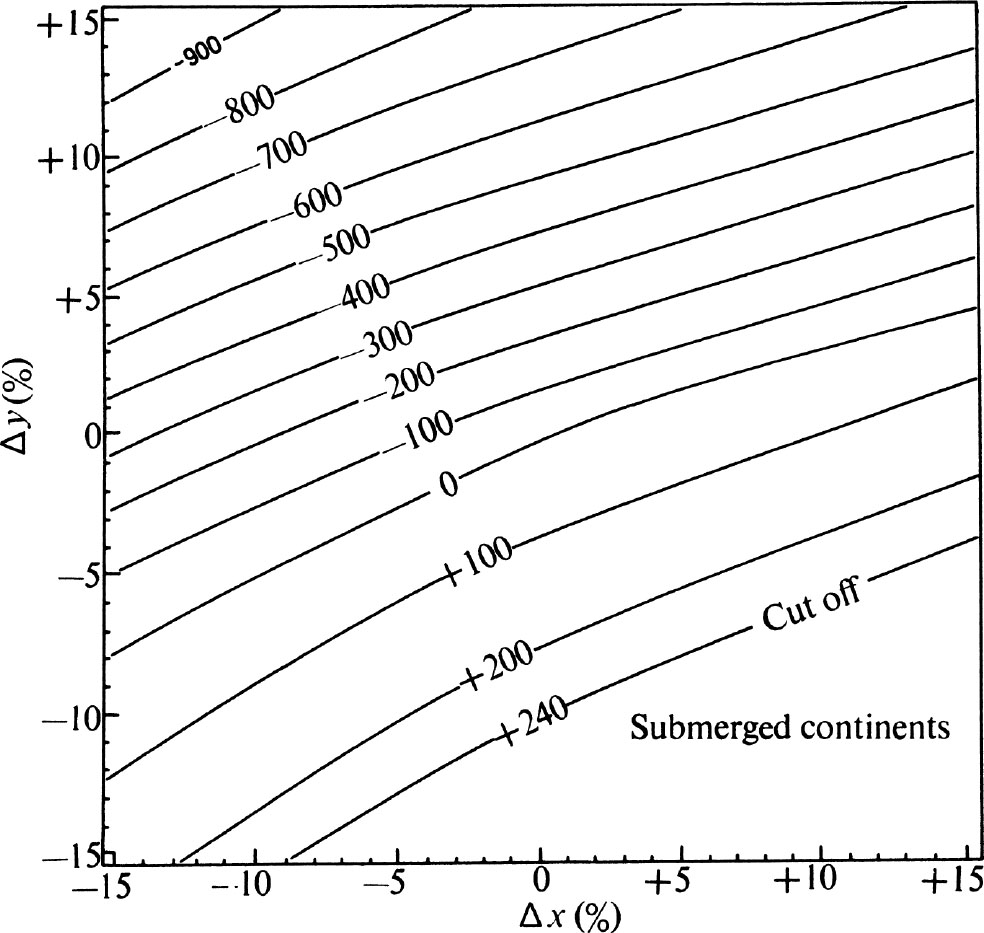
Fig. 2. Eustatic changes of sea level (m) relative to present sea level, contoured in terms of % change in continental area, x , and % change in ocean depth, y . For a rise of 240 m all continents are submerged.
The oceanic part of a plate steadily subsides as it spreads away from the mid-ocean ridge axis 3,19,20 and the aseismic continental margin undergoes a similar thermal subsidence that declines exponentially with a time constant of about 50×10 6 yr (ref. 21). Transgressions and regressions on young margins may be masked by this effect and are therefore likely to be best observed on margins older than 50 m.y. We have therefore examined the transgressions and regressions shown on Sleep’s generalized subsidence curve 21 for the old, Triassic 22 Atlantic margin of the United States for correlations with events in independently derived spreading histories 23,24 for the North Atlantic Ocean (Fig. 3). Our comparison shows a good correlation between the Oligocene regression and deceleration in spreading at 45 m.y. and correlations between earlier eustatic changes and spreading discontinuities. 中文
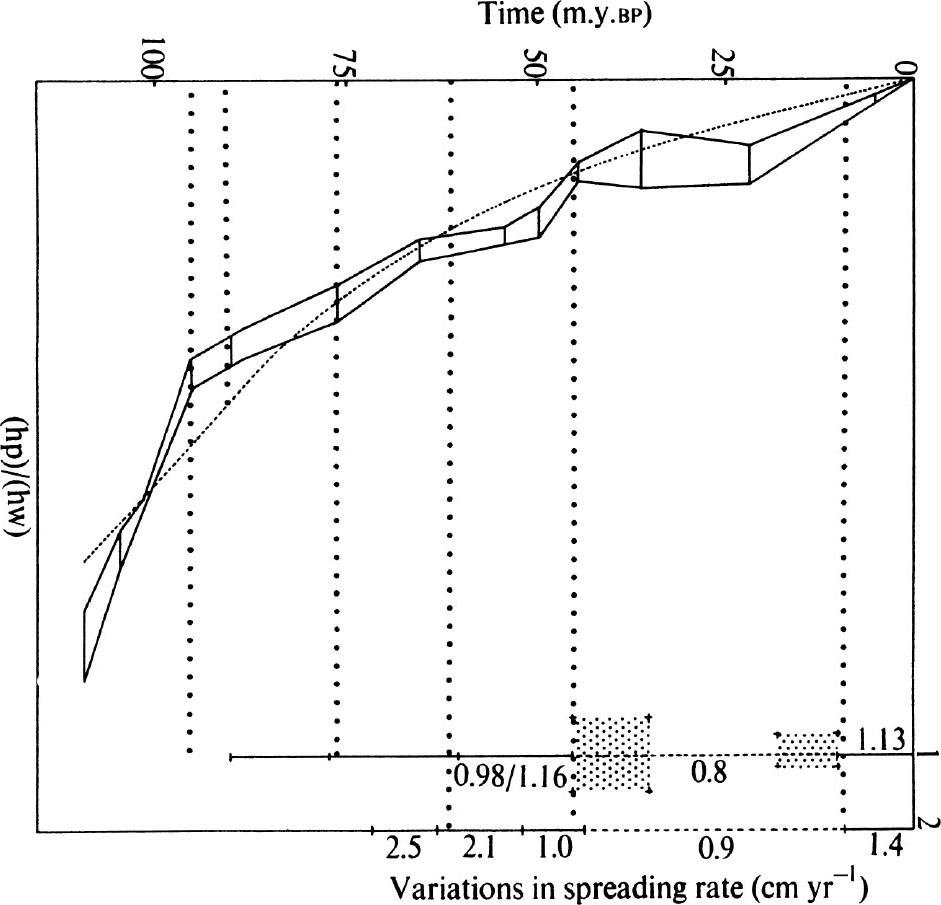
Fig. 3. Subsidence curve (---) for the Atlantic continental margin of the USA (from ref. 21). The depth normalized to the base of the Woodbine formation is plotted as a function of absolute age for wells on the East Coast. The error bars are 90% confidence limits. The subsidence curve is a 50 m.y. exponential constraint to fit data at the base of the Woodbine and at the surface. Kinks in the data correspond to eustatic changes. Spreading history of the North Atlantic derived independently is shown in column 1 (ref. 23) and column 2 (ref. 24). …, possible correlations between eustatic change and spreading. Shaded area, transition from one spreading mode to another 23 .
To check that this correlation does not reflect only the vertical movement of a particular plate, we have examined the Late Cretaceous and Cainozoic spreading histories of the major plates 25 for a global relationship. Global discontinuities in spreading have been postulated 23,25-28 ; our comparison (Fig. 4) shows a global deceleration in spreading at about 45 m.y., an acceleration at 10 m.y., and other discontinuities between 55 and 60 m.y. and about 70 m.y. Comparison of the ages of these discontinuities and eustatic changes documented on continental margins (Fig. 4 and Fig. 5) shows (within the limitations of the data) that the Oligocene-Miocene spreading deceleration is associated with a regression preceded by a minor transgression. The Late Miocene transgression just precedes the 10 m.y. acceleration and a transgressive-regressive phase may correlate with the 60 m.y. discontinuity. We therefore suggest that eustatic changes are connected with contemporaneous global spreading discontinuities and that older transgressions such as the Cenomanian will probably be associated with similar discontinuities. 中文
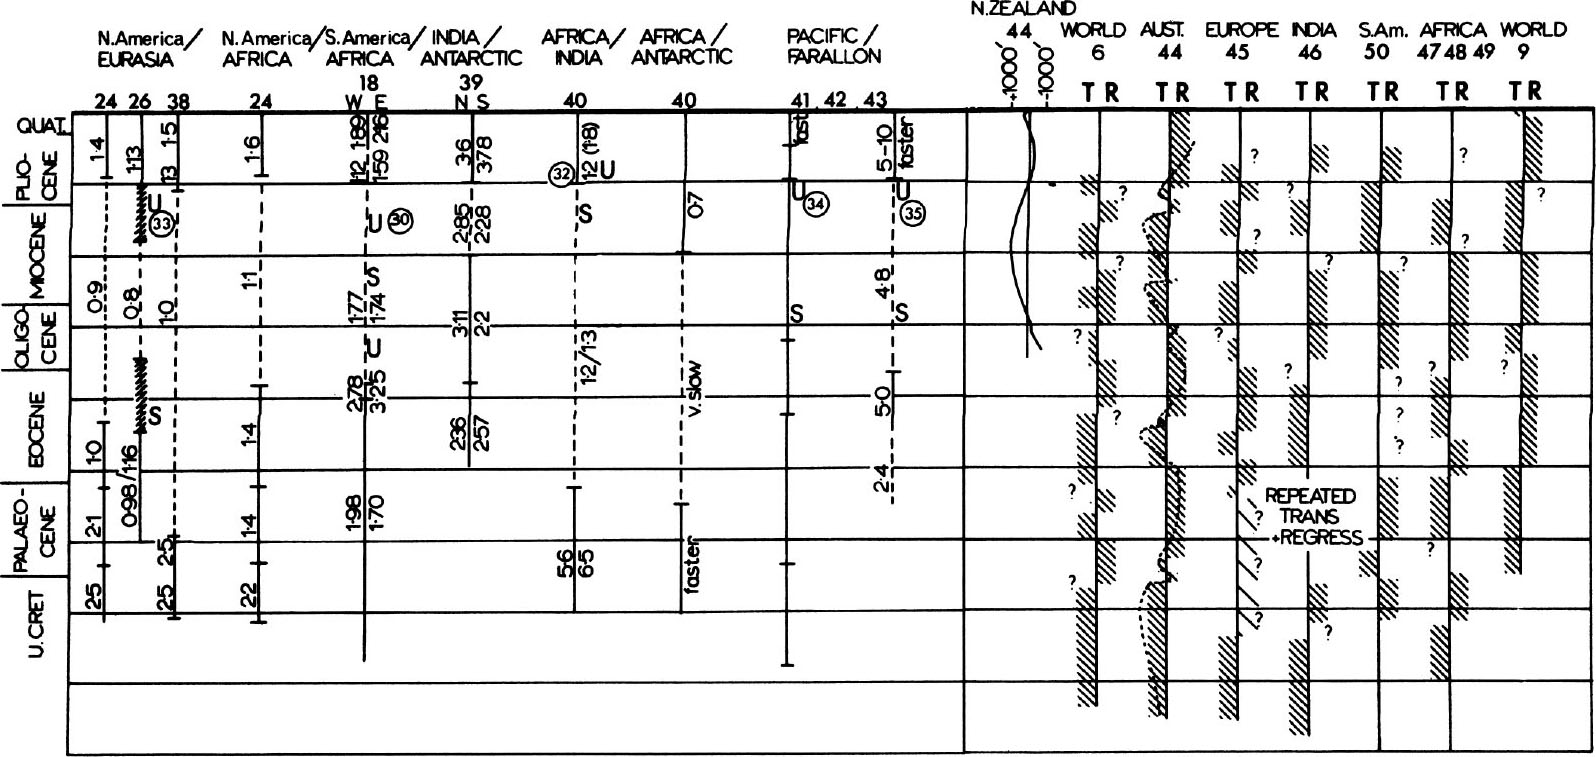
Fig. 4. Correlation between global discontinuities in spreading and global eustatic changes. ---, General reduction in spreading rate during the Oligocene and Miocene. Note correlation of uplift (U) and subsidence (S) with spreading rate changes and eustatic changes. Eustatic changes are shown as regressive (R) and transgressive phases (T) rather than curves showing interpreted amplitude of change. Circled numbers are references.
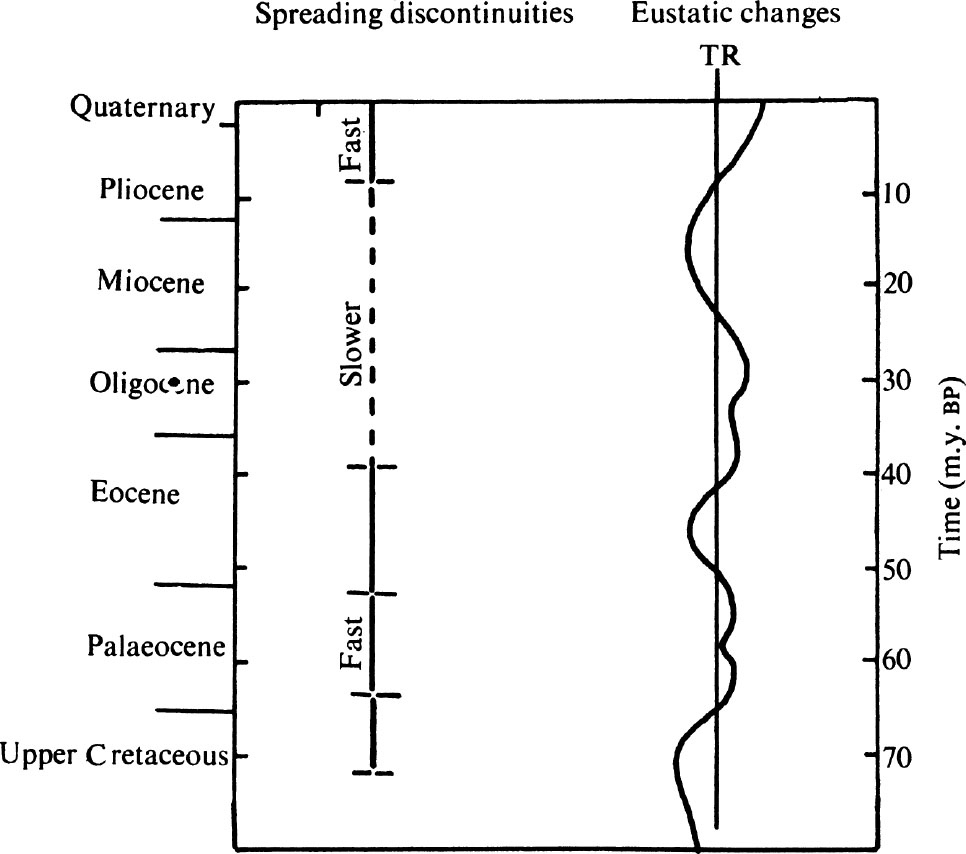
Fig. 5. Correlation between generalized global discontinuities in spreading and generalized global eustatic change (from Fig. 4). The eustatic change is necessarily approximate because of the limitations of the data.
A relationship between mid-ocean ridge elevation changes and eustatic changes has been suggested 3-13 and the relationship between ridge elevation and spreading rate 29 has been supported by statistical evidence 20 showing that ridges spreading slower than 3 cm yr –1 tend to be higher than faster ones. Decelerations in spreading should therefore be accompanied by uplift and accelerations by subsidence. But deep-sea drilling data 30 and spreading rates 18 for the southern Mid-Atlantic Ridge show the converse; the post 38 m.y. deceleration was followed by uplift in the Late Oligocene and subsidence in the Early Miocene; the ridge was uplifted to near its present elevation just before the 10 m.y. acceleration. Although these elevation changes correlate well with eustatic changes, the differences between the observed data and empirical model suggest that, at the slow (1.12 to 1.74 cm yr –1 ) spreading rates on this ridge 18 , effects such as phase changes 31 may also contribute to elevation changes. Other deep-sea drilling data 32-35 can also be interpreted to support uplift and subsidence accompanying spreading rate changes. The transgressive-regressive sequence may be due to elevation changes during the adjustment period observed at some discontinuities 26 . 中文
The paucity of deep sea drilling data does not permit us to estimate accurately eustatic changes caused by uplift and subsidence. But the southern Mid-Atlantic Ridge was uplifted 30 by between 500 and 1,000 m during the Late Miocene, a change of 25%. If we assume this uplift was not uniformly distributed over the South Atlantic 18 and that uplift on other ridges was not perfectly synchronous, we can reasonably consider a reduction in ocean depth of about 10%. A depth decrease of this order would, provided the continental area remained constant, result in a eustatic rise of about 500 m (Fig. 2) because the change depends on the prior form of the hypsographic curve. If the continental area decreased during uplift, the eustatic change would be rather less but more if the area increased. Estimates of a Middle Miocene transgression of 350 m 36 suggest our calculations are of the right order. 中文
The maximum eustatic rise of 300 m (including 60 m for deglaciation) implies uplift of all marine features now above 300 m. The maximal fall of 800 to 1,000 m indicates that sub-aerial processes may have influenced the morphology of the outer shelf, upper slope and canyons. Such a fall might have exposed sills in semi-enclosed seas resulting in circulation changes and possibly in complete evaporation; a lowering of this order could, for example, have contributed to the drying out of the Mediterranean in the Miocene 37 (see Fig. 2). 中文
We thank H. Charnock and A. S. Laughton for their comments on the manuscript. Peter Hunter drew the diagrams. 中文
( 243 , 19-22; 1973)
N. C. Flemming and D. G. Roberts
National Institute of Oceanography, Godalming, Surrey
Received October 12, 1972; revised February 12, 1973.
References: