
下载掌阅APP,畅读海量书库
立即打开


 Observation of a Rapidly Pulsating Radio Source
A. Hewish et al.
Editor’s Note
A survey of radio emission in the sky revealed a curiously periodic source, as reported here by Anthony Hewish and his colleagues (the actual discovery was made by Jocelyn Bell, who was at that time Hewish’s graduate student). The period was determined to be stable to one part in ten million, and the source showed no parallax, so it could not originate within the Solar System. The researchers also found three other sources with similar properties. Hewish speculated that they might arise from radial (in and out) pulsations of white dwarf stars or neutron stars. We now know that they arise from beams on rapidly rotating neutron stars (called pulsars), but the precise mechanism for generating the beams is still controversial. For this discovery, in 1974 Hewish became the first astronomer to be awarded the Nobel Prize in physics. 中文
I N July 1967, a large radio telescope operating at a frequency of 81.5 MHz was brought into use at the Mullard Radio Astronomy Observatory. This instrument was designed to investigate the angular structure of compact radio sources by observing the scintillation caused by the irregular structure of the interplanetary medium 1 . The initial survey includes the whole sky in the declination range –08°< δ < 44° and this area is scanned once a week. A large fraction of the sky is thus under regular surveillance. Soon after the instrument was brought into operation it was noticed that signals which appeared at first to be weak sporadic interference were repeatedly observed at a fixed declination and right ascension; this result showed that the source could not be terrestrial in origin. 中文
Systematic investigations were started in November and high speed records showed that the signals, when present, consisted of a series of pulses each lasting ~0.3 s and with a repetition period of about 1.337 s which was soon found to be maintained with extreme accuracy. Further observations have shown that the true period is constant to better than 1 part in 10 7 although there is a systematic variation which can be ascribed to the orbital motion of the Earth. The impulsive nature of the recorded signals is caused by the periodic passage of a signal of descending frequency through the 1 MHz pass band of the receiver. 中文
The remarkable nature of these signals at first suggested an origin in terms of man-made transmissions which might arise from deep space probes, planetary radar or the reflexion of terrestrial signals from the Moon. None of these interpretations can, however, be accepted because the absence of any parallax shows that the source lies far outside the solar system. A preliminary search for further pulsating sources has already revealed the presence of three others having remarkably similar properties which suggests that this type of source may be relatively common at a low flux density. A tentative explanation of these unusual sources in terms of the stable oscillations of white dwarf or neutron stars is proposed. 中文
The aerial consists of a rectangular array containing 2,048 full-wave dipoles arranged in sixteen rows of 128 elements. Each row is 470 m long in an E.–W. direction and the N.–S. extent of the array is 45 m. Phase-scanning is employed to direct the reception pattern in declination and four receivers are used so that four different declinations may be observed simultaneously. Phase-switching receivers are employed and the two halves of the aerial are combined as an E.–W. interferometer. Each row of dipole elements is backed by a tilted reflecting screen so that maximum sensitivity is obtained at a declination of approximately +30°, the overall sensitivity being reduced by more than one-half when the beam is scanned to declinations above +90° and below –5°. The beamwidth of the array to half intensity is about
 in right ascension and ±3° in declination; the phasing arrangement is designed to produce beams at roughly 3° intervals in declination. The receivers have a bandwidth of 1 MHz centred at frequency of 81.5 MHz and routine recordings are made with a time constant of 0.1 s; the r.m.s. noise fluctuations correspond to a flux density of 0.5×10
–25
W m
–2
Hz
–1
. For detailed studies of the pulsating source a time constant of 0.05 s was usually employed and the signals were displayed on a multi-channel “Rapidgraph” pen recorder with a time constant of 0.03 s. Accurate timing of the pulses was achieved by recording second pips derived from the
MSF
Rugby time transmissions.
中文
in right ascension and ±3° in declination; the phasing arrangement is designed to produce beams at roughly 3° intervals in declination. The receivers have a bandwidth of 1 MHz centred at frequency of 81.5 MHz and routine recordings are made with a time constant of 0.1 s; the r.m.s. noise fluctuations correspond to a flux density of 0.5×10
–25
W m
–2
Hz
–1
. For detailed studies of the pulsating source a time constant of 0.05 s was usually employed and the signals were displayed on a multi-channel “Rapidgraph” pen recorder with a time constant of 0.03 s. Accurate timing of the pulses was achieved by recording second pips derived from the
MSF
Rugby time transmissions.
中文
A record obtained when the pulsating source was unusually strong is shown in Fig. 1 a . This clearly displays the regular periodicity and also the characteristic irregular variation of pulse amplitude. On this occasion the largest pulses approached a peak flux density (averaged over the 1 MHz pass band) of 20×10 –26 W m –2 Hz –1 , although the mean flux density integrated over one minute only amounted to approximately 1.0×10 –26 W m –2 Hz –1 . On a more typical occasion the integrated flux density would be several times smaller than this value. It is therefore not surprising that the source has not been detected in the past, for the integrated flux density falls well below the limit of previous surveys at metre wavelengths. 中文
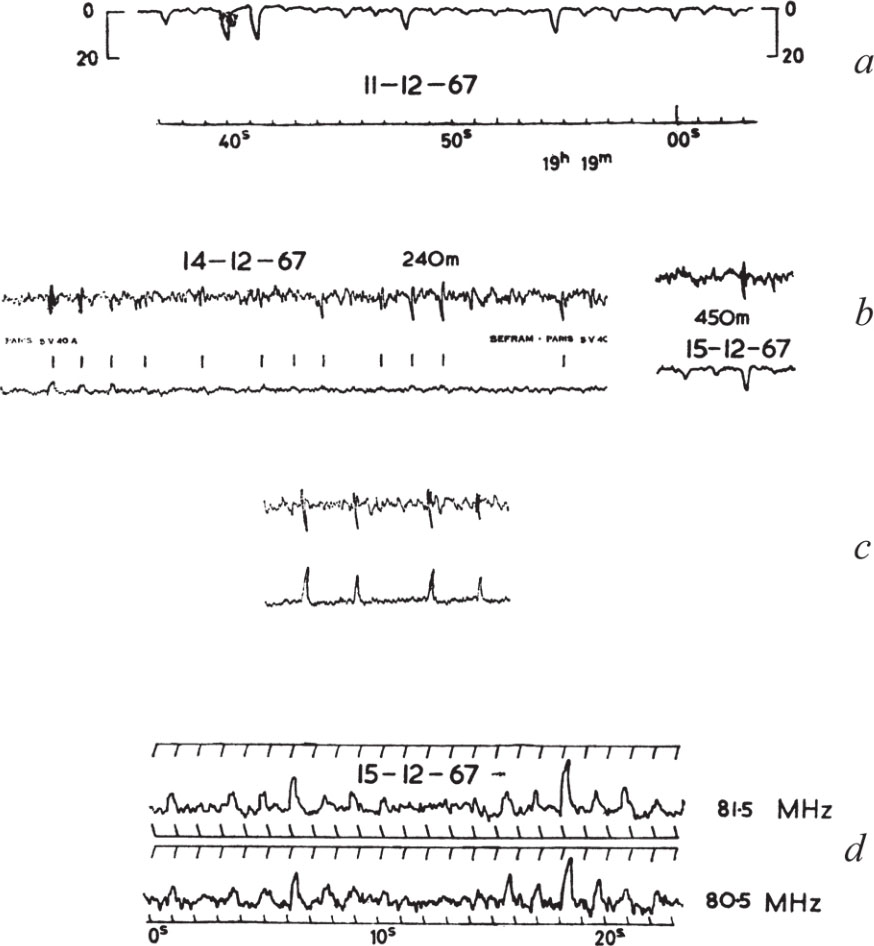
Fig. 1. a , A record of the pulsating radio source in strong signal conditions (receiver time constant 0.1 s). Full scale deflexion corresponds to 20×10 –26 W m –2 Hz –1 . b , Upper trace: records obtained with additional paths (240 m and 450 m) in one side of the interferometer. Lower trace: normal interferometer records. (The pulses are small for l =240 m because they occurred near a null in the interference pattern; this modifies the phase but not the amplitude of the oscillatory response on the upper trace.) c , Simulated pulses obtained using a signal generator. d , Simultaneous reception of pulses using identical receivers tuned to different frequencies. Pulses at the lower frequency are delayed by about 0.2 s.
The position of the source in right ascension is readily obtained from an accurate measurement of the “crossover” points of the interference pattern on those occasions when the pulses were strong throughout an interval embracing such a point. The collimation error of the instrument was determined from a similar measurement on the neighbouring source 3 C 409 which transits about 52 min later. On the routine recordings which first revealed the source the reading accuracy was only ±10 s and the earliest record suitable for position measurement was obtained on August 13, 1967. This and all subsequent measurements agree within the error limits. The position in declination is not so well determined and relies on the relative amplitudes of the signals obtained when the reception pattern is centred on declinations of 20°, 23° and 26°. Combining the measurements yields a position
α 1950 =19h 19m 38s ± 3s
δ 1950 =22°00′ ± 30′
As discussed here, the measurement of the Doppler shift in the observed frequency of the pulses due to the Earth’s orbital motion provides an alternative estimate of the declination. Observations throughout one year should yield an accuracy ±1’. The value currently attained from observations during December–January is δ=21°58′±30′, a figure consistent with the previous measurement. 中文
It was mentioned earlier that the signals vary considerably in strength from day to day and, typically, they are only present for about 1 min, which may occur quite randomly within the 4 min interval permitted by the reception pattern. In addition, as shown in Fig. 1 a , the pulse amplitude may vary considerably on a time-scale of seconds. The pulse to pulse variations may possibly be explained in terms of interplanetary scintillation 1 , but this cannot account for the minute to minute variation of mean pulse amplitude. Continuous observations over periods of 30 min have been made by tracking the source with an E–W. phased array in a 470 m×20 m reflector normally used for a lunar occultation programme. The peak pulse amplitude averaged over ten successive pulses for a period of 30 min is shown in Fig. 2 a . This plot suggests the possibility of periodicities of a few minutes duration, but a correlation analysis yields no significant result. If the signals were linearly polarized, Faraday rotation in the ionosphere might cause the random variations, but the form of the curve does not seem compatible with this mechanism. The day to day variations since the source was first detected are shown in Fig. 2 b . In this analysis the daily value plotted is the peak flux density of the greatest pulse. Again the variation from day to day is irregular and no systematic changes are clearly evident, although there is a suggestion that the source was significantly weaker during October to November. It therefore appears that, despite the regular occurrence of the pulses, the magnitude of the power emitted exhibits variations over long and short periods. 中文
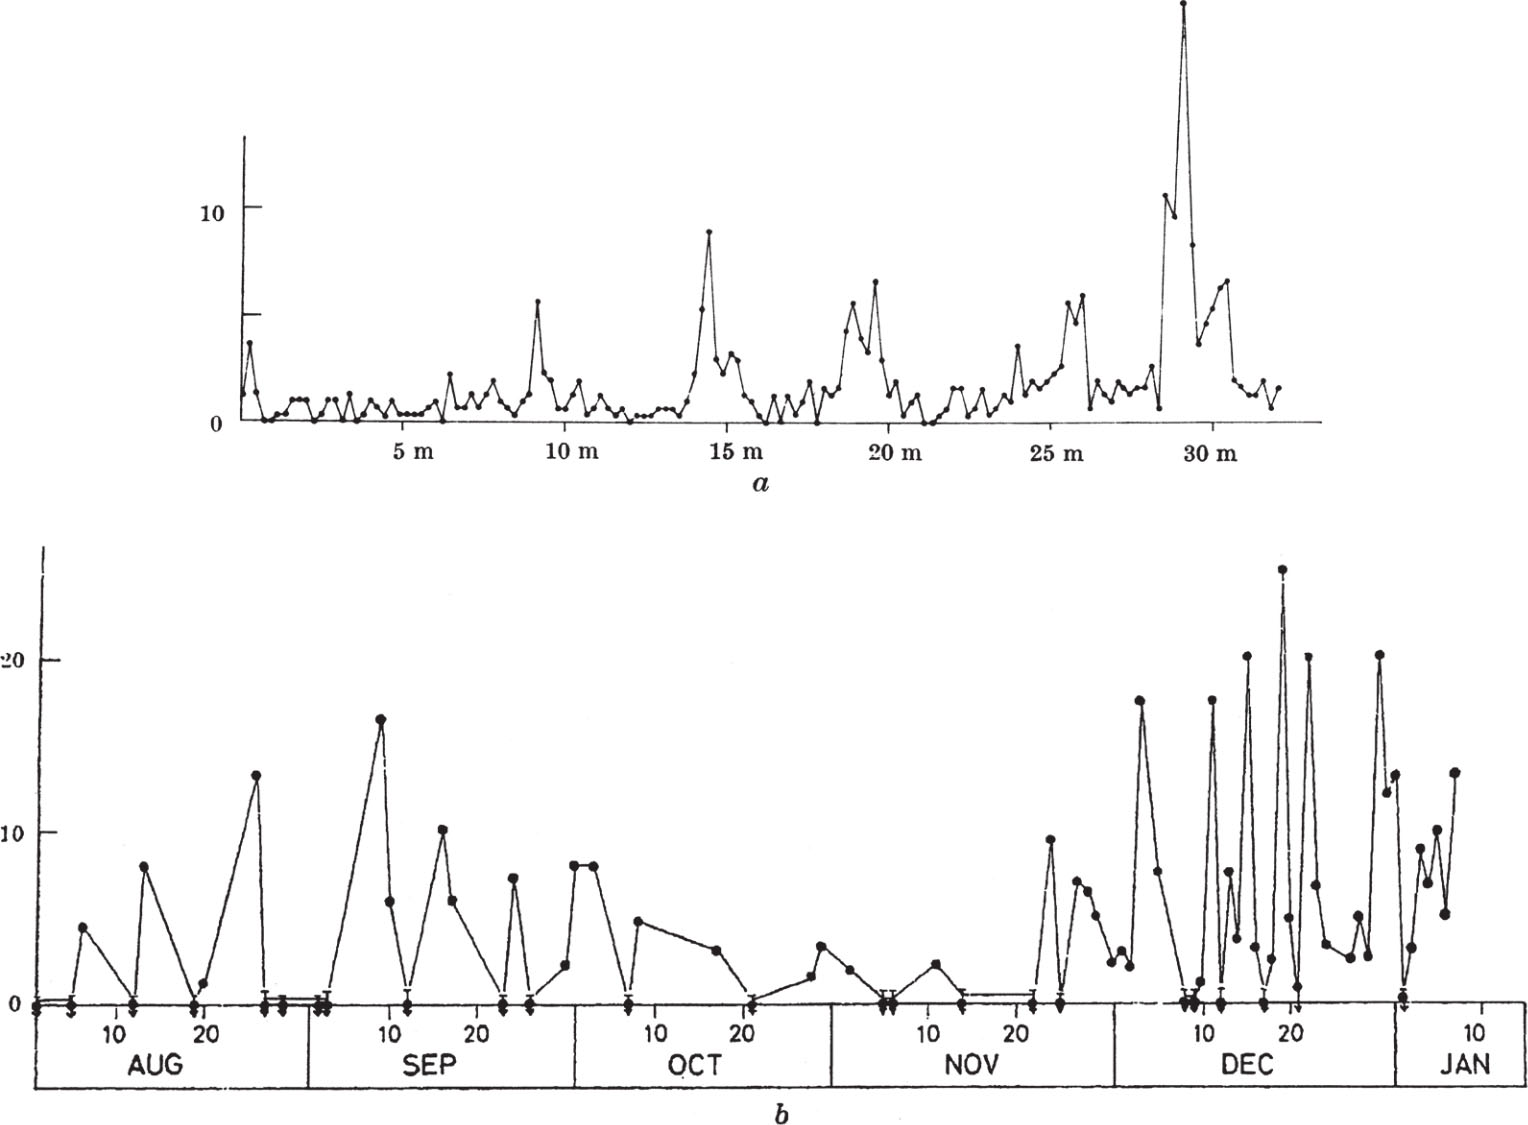
Fig. 2. a , The time variation of the smoothed (over ten pulses) pulse amplitude. b , Daily variation of peak pulse amplitude. (Ordinates are in units of W m –2 Hz –1 ×10 –26 .)
Two different experiments have shown that the pulses are caused by a narrow-band signal of descending frequency sweeping through the 1 MHz band of the receiver. In the first, two identical receivers were used, tuned to frequencies of 80.5 MHz and 81.5 MHz. Fig. 1 d , which illustrates a record made with this system, shows that the lower frequency pulses are delayed by about 0.2 s. This corresponds to a frequency drift of ~ –5 MHz s –1 . In the second method a time delay was introduced into the signals reaching the receiver from one-half of the aerial by incorporating an extra cable of known length l . This cable introduces a phase shift proportional to frequency so that, for a signal the coherence length of which exceeds l , the output of the receiver will oscillate with period
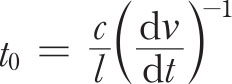
where d v /d t is the rate of change of signal frequency. Records obtained with l =240 m and 450 m are shown in Fig. 1 b together with a simultaneous record of the pulses derived from a separate phase-switching receiver operating with equal cables in the usual fashion. Also shown, in Fig. 1 c , is a simulated record obtained with exactly the same arrangement but using a signal generator, instead of the source, to provide the swept frequency. For observation with l >450 m the periodic oscillations were slowed down to a low frequency by an additional phase shifting device in order to prevent severe attenuation of the output signal by the time constant of the receiver. The rate of change of signal frequency has been deduced from the additional phase shift required and is d v /d t =–4.9±0.5 MHz s –1 . The direction of the frequency drift can be obtained from the phase of the oscillation on the record and is found to be from high to low frequency in agreement with the first result. 中文
The instantaneous bandwidth of the signal may also be obtained from records of the type shown in Fig. 1 b because the oscillatory response as a function of delay is a measure of the autocorrelation function, and hence of the Fourier transform, of the power spectrum of the radiation. The results of the measurements are displayed in Fig. 3 from which the instantaneous bandwidth of the signal to exp (–1), assuming a Gaussian energy spectrum, is estimated to be 80±20 kHz. 中文
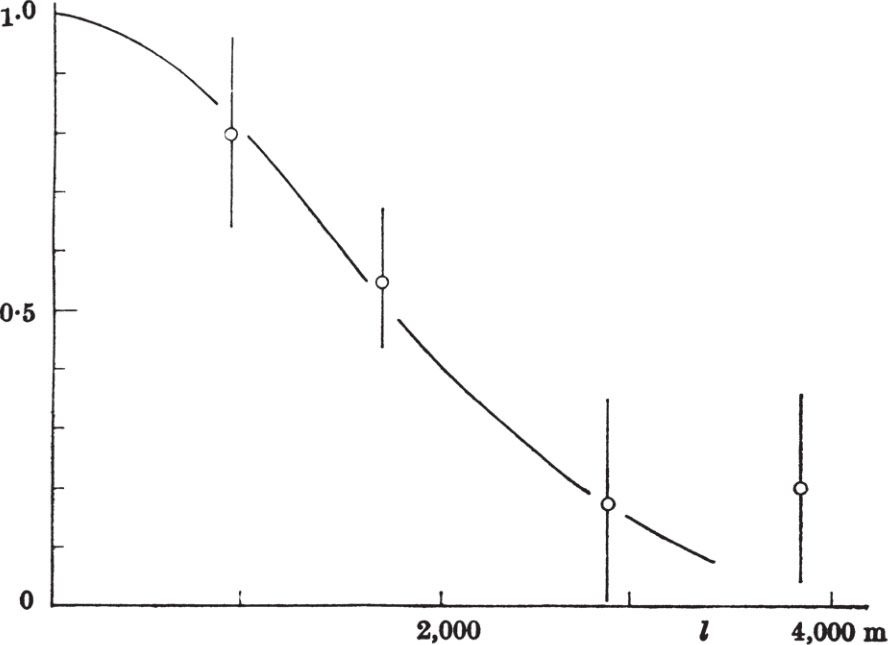
Fig. 3. The response as a function of added path in one side of the interferometer.
By displaying the pulses and time pips from MSF Rugby on the same record the leading edge of a pulse of reasonable size may be timed to an accuracy of about 0.1 s. Observations over a period of 6 h taken with the tracking system mentioned earlier gave the period between pulses as P obs =1.33733±0.00001 s. This represents a mean value centred on December 18, 1967, at 14 h 18 m UT. A study of the systematic shift in the frequency of the pulses was obtained from daily measurements of the time interval T between a standard time and the pulse immediately following it as shown in Fig. 4. The standard time was chosen to be 14 h 01 m 00 s UT on December 11 (corresponding to the centre of the reception pattern) and subsequent standard times were at intervals of 23 h 56 m 04 s (approximately one sidereal day). A plot of the variation of T from day to day is shown in Fig. 4. A constant pulse recurrence frequency would show a linear increase or decrease in T if care was taken to add or subtract one period where necessary. The observations, however, show a marked curvature in the sense of a steadily increasing frequency. If we assume a Doppler shift due to the Earth alone, then the number of pulses received per day is given by
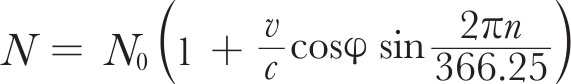
where N 0 is the number of pulses emitted per day at the source, v the orbital velocity of the Earth, φ the ecliptic latitude of the source and n an arbitrary day number obtained by putting n =0 on January 17, 1968, when the Earth has zero velocity along the line of sight to the source. This relation is approximate since it assumes a circular orbit for the Earth and the origin n =0 is not exact, but it serves to show that the increase of N observed can be explained by the Earth’s motion alone within the accuracy currently attainable. For this purpose it is convenient to estimate the values of n for which δ T /δ n = 0, corresponding to an exactly integral value of N . These occur at n 1 =15.8±0.1 and n 2 =28.7±0.1, and since N is increased by exactly one pulse between these dates we have
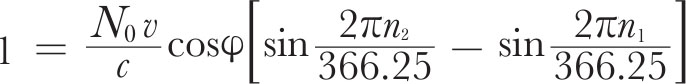
This yields φ =43°36′±30′ which corresponds to a declination of 21°58′±30′, a value consistent with the declination obtained directly. The true periodicity of the source, making allowance for the Doppler shift and using the integral condition to refine the calculation, is then
P 0 = 1.3372795±0.0000020 中文
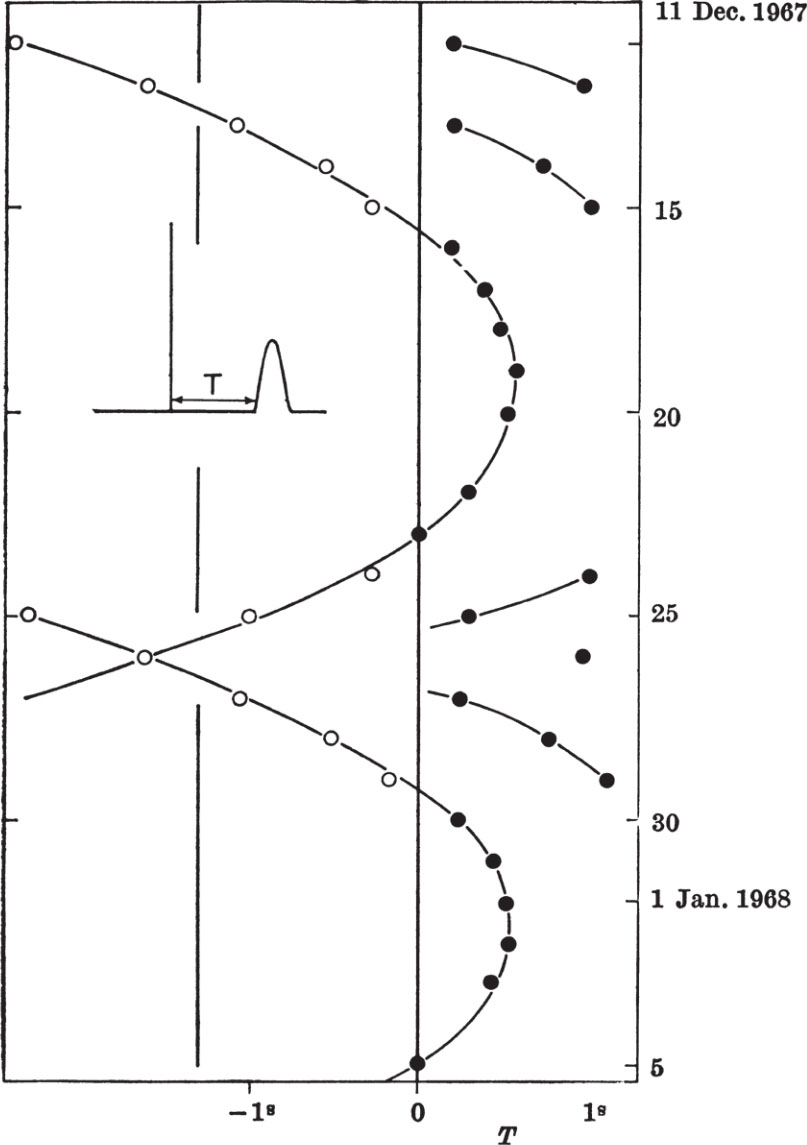
Fig. 4. The day to day variation of pulse arrival time.
By continuing observations of the time of occurrence of the pulses for a year it should be possible to establish the constancy of N 0 to about 1 part in 3×10 8 . If N 0 is indeed constant, then the declination of the source may be estimated to an accuracy of ±1′; this result will not be affected by ionospheric refraction. 中文
It is also interesting to note the possibility of detecting a variable Doppler shift caused by the motion of the source itself. Such an effect might arise if the source formed one component of a binary system, or if the signals were associated with a planet in orbit about some parent star. For the present, the systematic increase of N is regular to about 1 part in 2×10 7 so that there is no evidence for an additional orbital motion comparable with that of the Earth. 中文
The lack of any parallax greater than about 2′ places the source at a distance exceeding 10 3 A.U. The energy emitted by the source during a single pulse, integrated over 1 MHz at 81.5 MHz, therefore reaches a value which must exceed 10 17 erg if the source radiates isotropically. It is also possible to derive an upper limit to the physical dimension of the source. The small instantaneous bandwidth of the signal (80 kHz) and the rate of sweep (–4.9 MHz s –1 ) show that the duration of the emission at any given frequency does not exceed 0.016 s. The source size therefore cannot exceed 4.8×10 3 km. 中文
An upper limit to the distance of the source may be derived from the observed rate of frequency sweep since impulsive radiation, whatever its origin, will be dispersed during its passage through the ionized hydrogen in interstellar space. For a uniform plasma the frequency drift caused by dispersion is given by
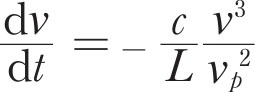
where L is the path and v p the plasma frequency. Assuming a mean density of 0.2 electron cm –3 the observed frequency drift (–4.9 MHz s –1 ) corresponds to L ~65 parsec. Some frequency dispersion may, of course, arise in the source itself; in this case the dispersion in the interstellar medium must be smaller so that the value of L is an upper limit. While the interstellar electron density in the vicinity of the Sun is not well known, this result is important in showing that the pulsating radio sources so far detected must be local objects on a galactic distance scale. 中文
The positional accuracy so far obtained does not permit any serious attempt at optical identification. The search area, which lies close to the galactic plane, includes two twelfth magnitude stars and a large number of weaker objects. In the absence of further data, only the most tentative suggestion to account for these remarkable sources can be made. 中文
The most significant feature to be accounted for is the extreme regularity of the pulses. This suggests an origin in terms of the pulsation of an entire star, rather than some more localized disturbance in a stellar atmosphere. In this connexion it is interesting to note that it has already been suggested 2,3 that the radial pulsation of neutron stars may play an important part in the history of supernovae and supernova remnants. 中文
A discussion of the normal modes of radial pulsation of compact stars has recently been given by Meltzer and Thorne 4 , who calculated the periods for stars with central densities in the range 10 5 to 10 19 g cm –3 . Fig. 4 of their paper indicates two possibilities which might account for the observed periods of the order 1 s. At a density of 10 7 g cm –3 , corresponding to a white dwarf star, the fundamental mode reaches a minimum period of about 8 s; at a slightly higher density the period increases again as the system tends towards gravitational collapse to a neutron star. While the fundamental period is not small enough to account for the observations the higher order modes have periods of the correct order of magnitude. If this model is adopted it is difficult to understand why the fundamental period is not dominant; such a period would have readily been detected in the present observations and its absence cannot be ascribed to observational effects. The alternative possibility occurs at a density of 10 13 g cm –3 , corresponding to a neutron star; at this density the fundamental has a period of about 1 s, while for densities in excess of 10 13 g cm –3 the period rapidly decreases to about 10 –3 s. 中文
If the radiation is to be associated with the radial pulsation of a white dwarf or neutron star there seem to be several mechanisms which could account for the radio emission. It has been suggested that radial pulsation would generate hydromagnetic shock fronts at the stellar surface which might be accompanied by bursts of X-rays and energetic electrons 2,3 . The radiation might then be likened to radio bursts from a solar flare occurring over the entire star during each cycle of the oscillation. Such a model would be in fair agreement with the upper limit of ~5×10 3 km for the dimension of the source, which compares with the mean value of 9×10 3 km quoted for white dwarf stars by Greenstein 5 . The energy requirement for this model may be roughly estimated by noting that the total energy emitted in a 1 MHz band by a type Ⅲ solar burst would produce a radio flux of the right order if the source were at a distance of ~ 10 3 A.U. If it is assumed that the radio energy may be related to the total flare energy (~10 32 erg) 6 in the same manner as for a solar flare and supposing that each pulse corresponds to one flare, the required energy would be ~10 39 erg yr –1 ; at a distance of 65 pc the corresponding value would be ~10 47 erg yr –1 . It has been estimated that a neutron star may contain ~10 51 erg in vibrational modes so the energy requirement does not appear unreasonable, although other damping mechanisms are likely to be important when considering the lifetime of the source 4 . 中文
The swept frequency characteristic of the radiation is reminiscent of type II and type III solar bursts, but it seems unlikely that it is caused in the same way. For a white dwarf or neutron star the scale height of any atmosphere is small and a travelling disturbance would be expected to produce a much faster frequency drift than is actually observed. As has been mentioned, a more likely possibility is that the impulsive radiation suffers dispersion during its passage through the interstellar medium. 中文
More observational evidence is clearly needed in order to gain a better understanding of this strange new class of radio source. If the suggested origin of the radiation is confirmed further study may be expected to throw valuable light on the behaviour of compact stars and also on the properties of matter at high density. 中文
We thank Professor Sir Martin Ryle, Dr. J. E. Baldwin, Dr. P. A. G. Scheuer and Dr. J. R. Shakeshaft for helpful discussions and the Science Research Council who financed this work. One of us (S. J. B.) thanks the Ministry of Education of Northern Ireland and another (R. A. C.) the SRC for a maintenance award; J. D. H. P. thanks ICI for a research fellowship. 中文
( 217 , 709-713; 1968)
A. Hewish, S. J. Bell, J. D. H. Pilkington, P. F. Scott and R. A. Collins: Mullard Radio Astronomy Observatory, Cavendish Laboratory, University of Cambridge.
Received February 9, 1968.
References: